River-REM
Iconem's companion app for river-relative elevation models, and how this app hands off to it
Canonical source
River-REM is a separate, complete app with its own repo — this page is only a summary. The source of truth is the RiverREM_UI README and the live app at rem.prod.heritagewatch.ai.
A Relative Elevation Model (REM) re-references a DEM to the local river water surface instead of sea level: sample the water surface elevation (WSE) along the river centerline, interpolate it across the terrain, then detrend with REM = DEM − WSE. The floodplain reads as flat, and paleochannels, terraces, bars, and meander scrolls pop out at meter scale — the technique popularized by Dan Coe and automated by the OpenTopography RiverREM Python package.
River-REM wraps that workflow in a browser app: pan to a river, and it extracts the centerline from OpenStreetMap waterway data, samples WSE from the DEM, interpolates, detrends, and styles the result live in a MapLibre color-relief layer. The REM is served as a single float band, so all color logic stays client-side and recolors instantly with no recompute.
Two engines, same styling
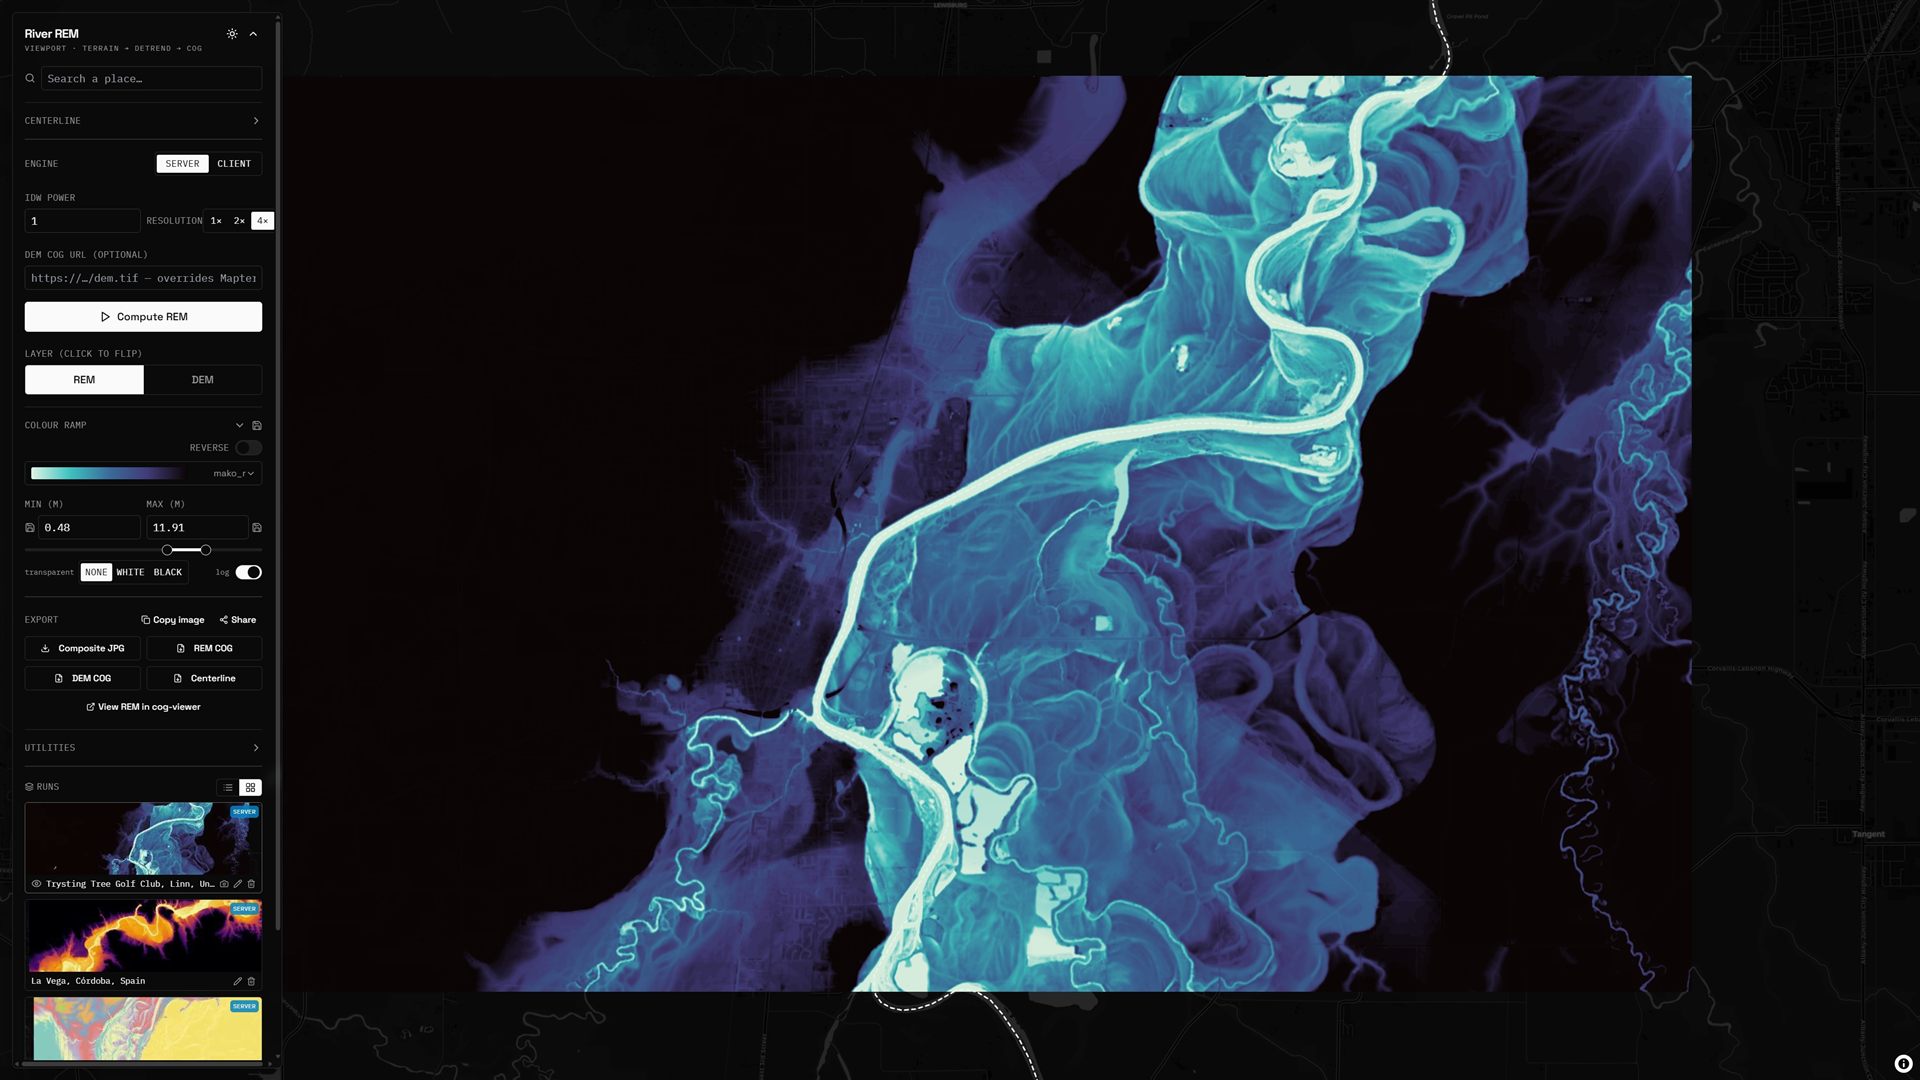
The River-REM app: a detrended relative elevation model styled with a color ramp, meander scrolls and paleochannels visible across the floodplain
The REM itself can be computed by either of two engines. The Server engine was the original implementation; the Client engine was added in a second iteration to make the whole pipeline run without a backend.
- Server engine (default) — FastAPI + GDAL running the OpenTopography RiverREM package. It mosaics Mapterhorn tiles into a UTM DEM, samples WSE along the centerline, and interpolates with k-NN IDW (power 1, KD-tree, with
kderived from river sinuosity). Output is a full-fidelity single-band Float32 Cloud-Optimized GeoTIFF in EPSG:3857 — reusable across sessions and exportable (COG, DEM, GeoJSON centerline, JPG composite). Strengths: fidelity, full resolution, exports. - Client engine (beta) — pure JavaScript/WebGL, no backend required. A custom MapLibre
rem://{z}/{x}/{y}protocol fetches Mapterhorn terrain tiles on demand, detrends each one live, and re-encodes the result as Terrarium tiles — with the deepest available Mapterhorn zoom probed per viewport so tiles are never over-requested. Its IDW weights all sampled points with a configurable power (QGIS-style), and two faster interpolation modes are available (see below). Strengths: no backend, live recompute, speed.
Both engines feed the exact same MapLibre color-relief layer, so the styling controls are identical either way: 15+ cpt-style color ramps with custom import, independent min/max bounds, transparency fading, REM vs. DEM layer toggling, basemap selection, a localStorage run history with rename/delete/duplicate, and URL-based state persistence via nuqs. Terrain comes from Mapterhorn tiles by default, with custom elevation COG ingest supported.
WSE interpolation modes
Detrending needs a water surface elevation value at every DEM cell, but WSE is only sampled along the centerline — so the core algorithmic choice is how to spread those sparse samples across the grid. The client engine offers three modes, all flagged experimental in the UI ("REM built live in the browser, no server compute"), all reading the Mapterhorn DEM directly:
- IDW — inverse-distance weighting. The classic approach (and what the server engine uses): each cell's WSE is a power-weighted mean of the sampled river points — in-app defaults are power 2 with 150 river samples. Smooth and well-known, but
O(cells × samples)per query, and it produces radial "bull's-eye" halos around sample points where sample density is low. The app itself warns IDW is slow — prefer JFA or EDT. - JFA — nearest-polyline. Each cell takes the WSE of the nearest point on the river polyline: project the cell onto the nearest river segment and linearly interpolate WSE between the segment's endpoint elevations. Geometrically this is a labeled Voronoi allocation of the continuous polyline — the assignment a jump-flooding algorithm computes — and it's physically the most hydrological model (WSE at a floodplain point equals the elevation of the nearest centerline point). Cross-channel bands are perfectly clean, with no bull's-eyes by construction. One caveat: nearest is Euclidean nearest, so in a tight meander neck a cell can attach to the wrong reach across the neck.
- EDT — Euclidean distance transform. A rasterized labeled distance transform: burn the centerline into the grid (Bresenham, writing linearly-interpolated WSE at each covered cell), then resolve nearest-seed labels with a column-wise two-pass scan followed by a row-wise Felzenszwalb–Huttenlocher parabola lower envelope. Total cost is
O(cells)after the burn — versusO(cells × segments)for nearest-polyline — making it the fastest mode at high grid resolutions. The only trade-off is slight rasterization aliasing of band edges at coarse grids (imperceptible from 512² up).
Centerline extraction and river selection
The centerline doesn't have to come from OSM at all: you can draw it by hand directly on the map, or import your own (GeoJSON or shapefile) — useful for paleochannels or historical courses OSM has no notion of. The default path, though, extracts it from OpenStreetMap waterway data covering the current view, fetched from a configurable source:
- QLever OSM endpoint — the fast SPARQL-backed option
- Overpass API remotes — overpass.de, Kumi Systems, Private Coffee, or osm.ch
- OSM vector tiles, decoded client-side — Shortbread MVT, OpenFreeMap MVT, or Protomaps PMTiles
Which waterways make it into the centerline is a separate choice, with three selection modes: the longest named river (the default — one clean trunk), all named rivers, or all waterways including unnamed ones (side channels, canals, streams).
How it connects to this app
Open In → Iconem River-REM. The sidebar's Open In launcher hands off the current viewport directly — it builds https://rem.prod.heritagewatch.ai/?lng=…&lat=…&zoom=…, so the spot you're inspecting here opens at the same camera there. Typical flow: scout a floodplain in this app (hillshade, LRM, historical imagery), then jump to River-REM for the river-referenced detrend and its COG/centerline exports.
LRM is the generic cousin. This app's Local Relief Model viz mode also subtracts a trend surface from the DEM — but its trend is an isotropic low-pass blur (an ancestor tile of the pyramid), with no notion of a river. A REM's trend is the interpolated water surface itself, which is what makes "meters above river level" physically meaningful in a floodplain where LRM only shows "higher/lower than the neighborhood mean." Same idea applies to the Elevation Picker's Sample Reference: Absolute vs. LRM option — a per-point version of the same detrending trade-off.
Shared lineage. The two apps share an author (Iconem / jo-chemla) and a stack (React + Vite, MapLibre GL, nuqs URL state, Mapterhorn terrain) — this app's Bookmarks Runs/Gallery UI was directly modeled on RiverREM_UI's runs list and gallery modal (see the header comment in lib/bookmarks.ts).