Bring Your Own Data (BYOD)
Adding your own terrain/basemap sources, including local files
Add your own terrain or basemap source from the "Add New Terrain Dataset" dialog (Sources → Terrain/Basemap). Supported shapes:
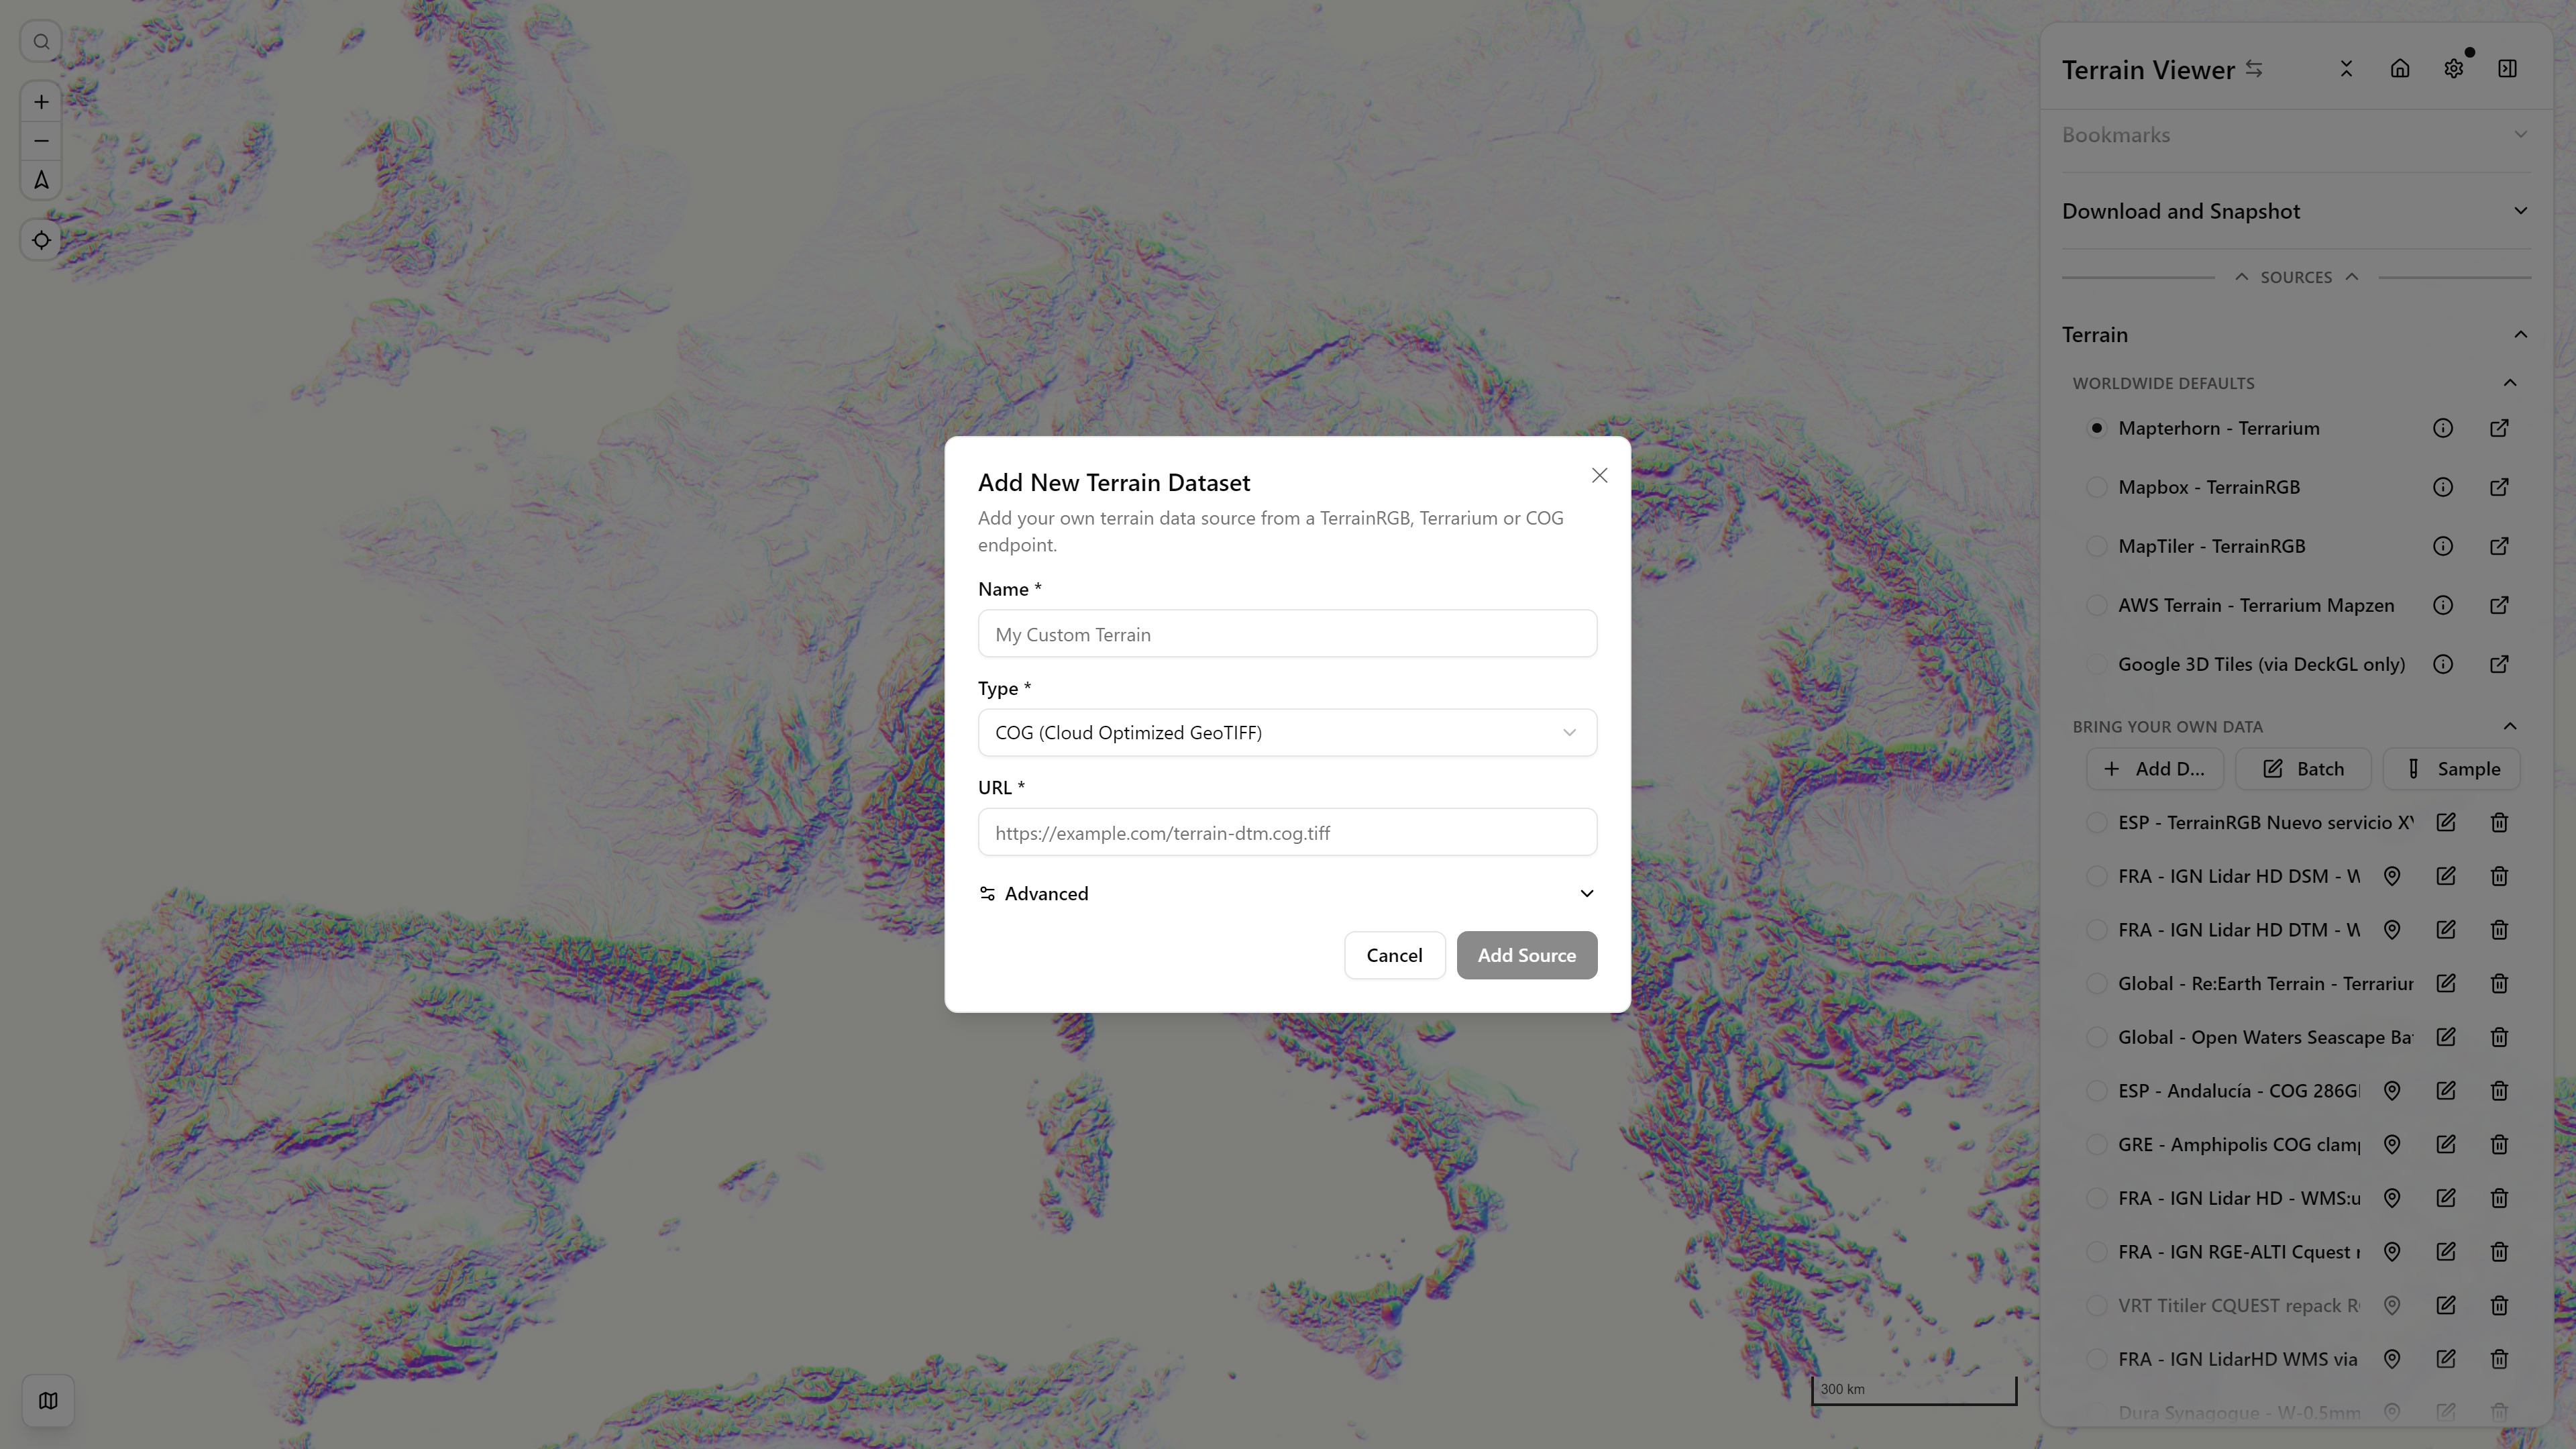
Add New Terrain Dataset dialog, with the Sample datasets already loaded behind it — Hillshade (Aspect Multidir Colors), wide Western Europe view
- XYZ Terrarium or Terrain-RGB tiles (a raw tile URL template) — the same encoding used by Mapterhorn, Mapbox, MapTiler, and AWS Terrain Tiles, this app's built-in terrain sources
- COG (Cloud-Optimized GeoTIFF), via Titiler or read directly in-browser via @geomatico/maplibre-cog-protocol. On the geomatico path (the default — see Streaming & Storage Settings), a DSM/DEM GeoTIFF must be both a genuine COG — internally tiled and pyramided with overviews — and in Web Mercator (EPSG:3857); anything else, route it through Titiler (which reprojects server-side) or fix it up first:
gdalwarp -t_srs EPSG:3857 -of COG src.tif out.tif.
A heavily-loaded Terrain source list — several custom BYOD sources (national LiDAR DSMs, a Copernicus GLO-30 export) alongside the built-in defaults — comparing two of them side by side is exactly what Split Modes covers.
Shareable via URL: a link whose sourceA/sourceB/basemapSource… params reference a sample-library id (e.g. ?sourceB=custom-ign-lidarhd-dtm-wms-raw) auto-adds that source to the recipient's BYOD list on load, and ?addSources=id1,id2 prepopulates several samples at once without selecting any of them — handy for handing a colleague both the IGN DSM and DTM ready to toggle between.
Auto: paste any URL
A new source opens on Auto: one URL field. Paste a link and the dialog recognises what it is (a tile template, a WMS, an ArcGIS service, a COG, a VRT, PMTiles, a TileJSON, a STAC catalog, an Allmaps or IIIF map), switches to the matching type with the URL in its field, and says what it found. What is recognised, from the URL and then from the response headers, is on Auto source detection.
WMS zoom ranges
A WMS answers any bounding box, so a zoom outside a layer's scales does not fail: it comes back as an empty or transparent image, and the map would show nothing there. When a WMS layer is added (from the layer list, or a pasted GetMap URL), the dialog asks the server for one tile per zoom, around the map's centre or the layer's extent, keeps the zooms whose image holds pixels, and fills Min Zoom and Max Zoom under Advanced. They stay editable, and Detect asks again after moving the map over the layer. Beyond the maximum the map stretches the last real zoom instead of fetching empty tiles.
Searching catalogs
Both dialogs can search catalogs instead of taking a URL: a STAC catalog or API, NextGIS QMS and the OSM Editor Layer Index. They have their own page, Catalog search. One more type takes a URL that is not a tile service:
- IIIF map with a Georeference Annotation (basemaps, always an overlay): an old map or plan already georeferenced with Allmaps, or any service that writes the IIIF Georeference extension. Paste the annotation URL (
https://annotations.allmaps.org/maps/<id>, or a manifest's or image's annotation page): the IIIF image is warped on the GPU from the annotation's control points and mask by Allmaps' MapLibre layer, so nothing is pre-rendered and the map stays sharp at every zoom. The quickest way to find one is the Old maps (Allmaps) coverage overlay below: click an outline, then Use as overlay.
Where a source has data is what Coverage Overlays show, on the map, before you load it.
Derived terrain: the difference of two sources
Add Terrain → Difference of two sources makes a terrain source out of two others, subtracted tile by tile: a normalised surface model (DSM − DTM, the height of what stands on the ground) or the change between two surveys. It has its own page, nDSM and Comparison, including the caveats on vertical datums and coarse references.
Local (offline) COG terrain sources
Two ways to use a COG that lives on your own disk, without uploading it anywhere:
Local COG file (built into the app)
Pick a .tif/.tiff with the Local COG file (this browser only) type — the app streams it straight off disk via a blob: URL through the same cog:// reader used for remote COGs.
- Never uploaded. Not persisted by default — after a reload, re-select the same file to resume — unless you enable Settings → Browser Local Storage Persistence → Local COG Files, which copies picked files into the browser's private storage (OPFS) so they survive reloads; that panel also shows per-category storage usage against the site's quota, with a Clear button to free it. Local COGs can also travel inside a Project export (Settings → Project) as part of its
.zipbundle. - Works for the primary terrain source and its derivative visualizations, the Elevation Picker, and client-side GeoTIFF export. Contour Lines still needs Titiler (it can't reach a local file).
- Must be a genuinely tiled COG (e.g.
gdal_translate -of COG src.tif out_cog.tif), not a plain strip-organized GeoTIFF — an untiled file forces large repeated decodes and can crash the tab. - Must already be in Web Mercator (EPSG:3857) — reproject first with
gdalwarp -t_srs EPSG:3857 -of COG src.tif out_3857.tifif it isn't, or use the remote COG type in Titiler mode instead (which reprojects server-side).
Localhost static file server
Serve the directory containing your COG with any Range-request-capable static server:
npx serve --cors -p 8080 .Then add it as a normal COG source with URL http://localhost:8080/your-file.tif. http://localhost is exempt from mixed-content blocking, so this HTTPS app can fetch it directly. Unlike the built-in local-file picker, this survives reloads and works in any browser.
Editing the lists
The source lists open in a reading mode: each row offers its info (every field the source carries, its ground resolution declared or estimated from the max zoom, a fit-to-extent button) and, for an overlay, its opacity pill right after the view buttons. Hovering a name tells what the source is before clicking: its type, where it comes from (QMS, the Editor Layer Index, Allmaps), its ground resolution, attribution and description; the resolution also sits after the name. The pencil button switches the edit mode on for both lists: rows then show edit and delete, and the braces button left of the pencil opens every source as JSON (Batch edit, Ctrl+Enter saves).
Non-geo relief visualization
For non-georeferenced data (e.g. frescoes, artifact scans), see Frescoes & Artifact Scans for the workflow (including a real built-in sample), or the Non-Geo Relief Visualization guide directly for the COG parameters needed to avoid artifacts.
Coverage Overlays
See where each terrain or basemap source actually has data, before switching to it
Auto source detection
Paste any URL in Add Terrain or Add Basemap and the dialog finds its type - tile templates, WMS, ArcGIS, COG, VRT, PMTiles, TileJSON, STAC, Allmaps and IIIF - from the URL itself, then from the response headers and first bytes