Coverage Map of LiDAR, DEM and Imagery Sources
See on the map where each elevation or imagery source has data before switching to it: national LiDAR footprints, DEM tiles, 3D coverage, historical imagery footprints, with the sources covering any point you hover.
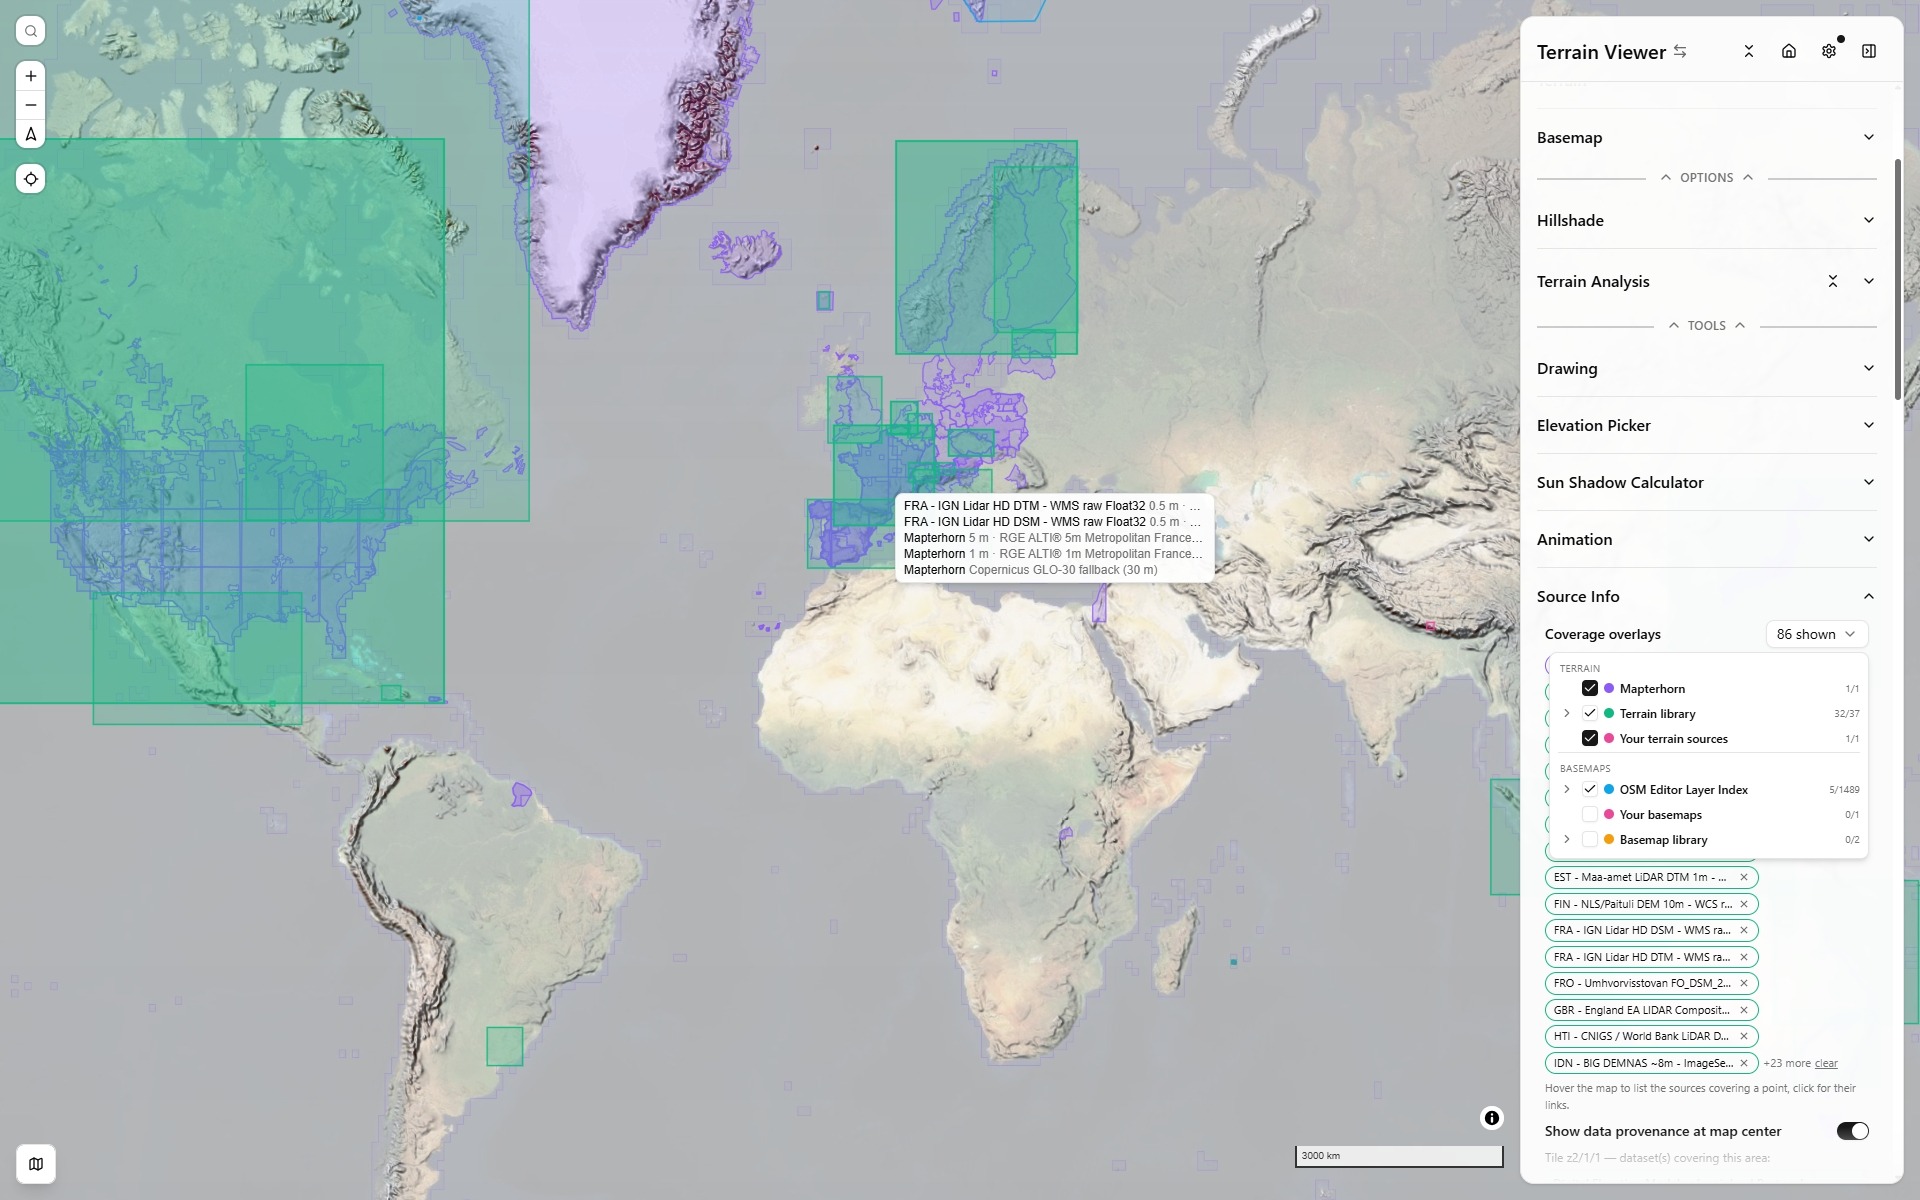
Sources Coverage
Sources Coverage is the section under Terrain and Basemap in the Sources group. Its second part, Source info, answers "what am I actually looking at?" for whatever is loaded right now. For each active terrain source and basemap it shows:
- the dataset's name, provider and licence, with attribution text ready to copy;
- its resolution — a declared native grid where the dataset states one, otherwise the ground size of one pixel at its maximum zoom at the current latitude (
z19 ≈ 30 cm/px), which is the only honest figure a tile service can give; - the endpoint actually being requested, and a link to the dataset's own page;
- for COGs, links to open the same file in an external viewer (source.coop, GeoLibre);
- and the coverage picker described below.
Source info has two folds, Basemap above and Terrain below. Each basemap row shows its provider prefix, its type and its resolution, with an info button that opens the full metadata dialog. The terrain fold's Show data provenance at map center lists the datasets covering the tile at the centre of the view; it waits until zoom 5, since a coarser tile spans half a continent.
Sources that arrived from a catalog keep their provenance: an Editor Layer Index layer carries its index entry and licence, a STAC item carries its collection.
It is also where a source found under the cursor can be switched into view A in one click — the hover list below sorts what covers a point by increasing ground sample distance, so the sharpest dataset available there is first.
Coverage overlays
Its first part is the Coverage overlays picker (terrain and basemaps). In the picker, the arrow after a dataset opens its own page and the + puts it on the map: a library entry joins your list and becomes view A's terrain or basemap, an Editor Layer Index layer becomes a basemap or overlay. It draws the footprint of sources on every map view, so a blank area can be told apart from a slow one, and so you can see which national dataset or which imagery layer covers the place you are looking at before loading it.
The selection is part of the shared link (coverageOverlays), so a view you send keeps its footprints, and Sources Coverage opens with it so the footprints have a visible origin.
A whole group is carried as its group key, not as its members: ticking the Terrain library writes ?coverageOverlays=library, not the 45 ids it stands for. Untick one entry and the other 44 spill out, because there is no longer a group to name. The foldable group keys are library and basemapLibrary — the two whose membership is fixed at build time. mapterhorn is a single footprint and always travels as itself.
The other three groups — eli, yourTerrain, yourBasemaps — name sources that only exist in your session, so a link carries their ids rather than the group key. You can still write those keys by hand: ?coverageOverlays=yourTerrain is expanded against whatever is loaded when the link opens.
What is offered
The picker is a small tree, independent of what is loaded in your Terrain and Basemap lists. Tick a group to draw all of it, or expand it (chevron on the left) and pick a handful of entries. How each footprint is made is on Coverage Footprints.
Terrain
- Mapterhorn — the built-in terrain's own coverage, streamed from Mapterhorn's coverage vector tiles. Each polygon carries the id of the national source Mapterhorn ingested there; areas that fall back to Copernicus GLO-30 are drawn hollow. Hovering shows the product name, producer and grid resolution, read once from Mapterhorn's attribution table.
- Terrain library — the declared bounds of every dataset in the national datasets library, loaded or not.
- Your terrain sources — custom terrain sources you added yourself that declare bounds (Advanced section of the Add Terrain dialog) and are not library entries.
3D and LiDAR coverage
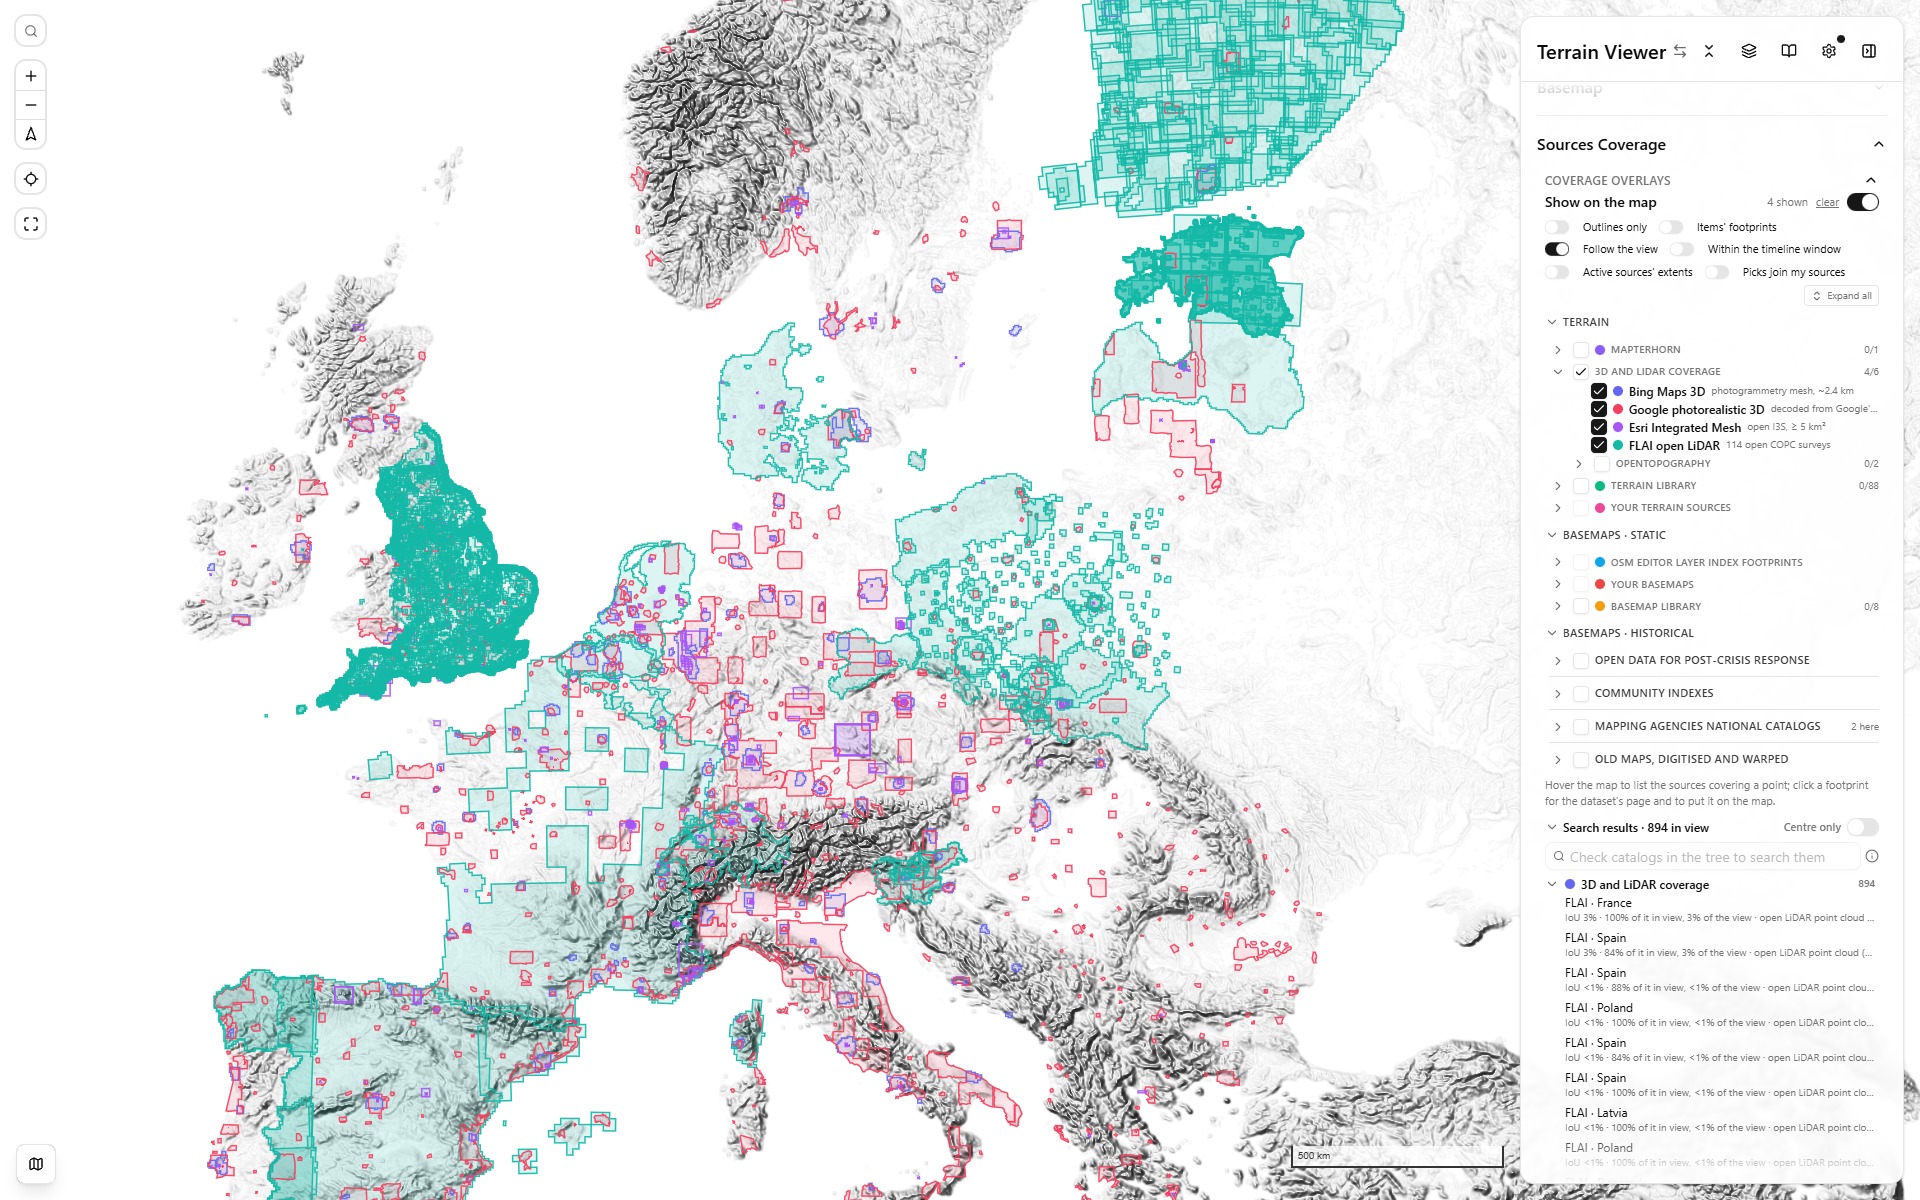
The four 3D and LiDAR overlays on one switch, over Europe - Bing (indigo), Google (rose), Esri Integrated Mesh (violet), FLAI (teal)
- Bing Maps 3D (photogrammetry) — where Bing Maps 3D actually has mesh: the photogrammetry behind Bing's 3D cities and Flight Simulator. Not something this app can draw, but "is there photogrammetry here?" belongs on the same map as "is there a fine DEM here?". Includes terrain photogrammetry of parks (Rainier, Yellowstone, the Grand Canyon), not only cities.
- Google 3D (photorealistic) — the same question for Google’s mesh. Google publishes no machine-readable coverage, so the footprints are decoded from the coverage layer behind its own docs page and simplified to about half a kilometre, which is the scale of the question.
- FLAI open LiDAR — 114 open point clouds republished as COPC at hub.flai.ai. Not a DEM, but the same question: is there anything better than global 30 m here? These are real flown footprints, not bounding boxes, which is why France comes out as France rather than as the rectangle around it. Click one to open it in FLAI Hub at the same view.
- OpenTopography: the footprints of the rasters and point clouds hosted by OpenTopography. Clicking one opens the dataset's page, with its DOI and downloads.
- Esri Integrated Mesh — every public photogrammetric I3S scene layer on ArcGIS Online over 5 km², one rectangle per service: 1 644 of them, cities down to districts (smaller ones are mostly one drone flight over one building site). None of it is renderable here, I3S being Esri’s own format, so clicking a footprint opens that one service in Esri’s Scene Viewer instead — the service alone, so nothing else in the scene collides with the mesh.
Basemaps
- OSM Editor Layer Index — the real coverage polygons of the Editor Layer Index layers whose footprint touches the current view at the moment the picker opens. Worldwide layers have no footprint and are left out.
- Your basemaps — custom basemaps with declared bounds, or added from the Editor Layer Index (those use the index polygon).
- Basemap library — the sample basemaps that declare bounds.
- NextGIS QMS works the same way for the Quick Map Services catalog: one query to its
intersects_extentfilter with the view returns the working TMS and WMS services whose declared extent touches it, drawn as outlines and refreshed as you move. The extents follow the zoom too: services much smaller than the view drop out when zoomed out, continental and worldwide ones when zoomed in, while a national basemap stays listed over a city. Clicking an outline lists the services there, each linking to its catalog page, with Use as basemap. - Old maps (Allmaps) draws the outline of every georeferenced historical map in the view, from one call to the Allmaps annotations API (
/maps.geojson, up to 200 outlines, refreshed as you move). The maps come from every institution publishing IIIF maps georeferenced with Allmaps (Leiden, TU Delft, the Leventhal Map Center, the Bibliothèque nationale de France, the Internet Archive and more); David Rumsey Map Collection is the same query filtered to his image server, since his roughly 57,000 georeferenced maps were imported into Allmaps from his Georeferencer data. The size window follows the zoom: zoomed in you get city and building plans, zoomed out regional maps, and never a world map tinting a street view. Outlines are drawn without fill, since a city has hundreds overlapping. Clicking one lists every map under the point, finest first, with a link to the map's own page (David Rumsey's catalog page, otherwise the Allmaps viewer) and Use as overlay, which drapes it warped from its annotation.
The dated historical catalogs (post-crisis imagery, the national archives, the old-map warpers) are listed on Historical Sources.
The coverage tree
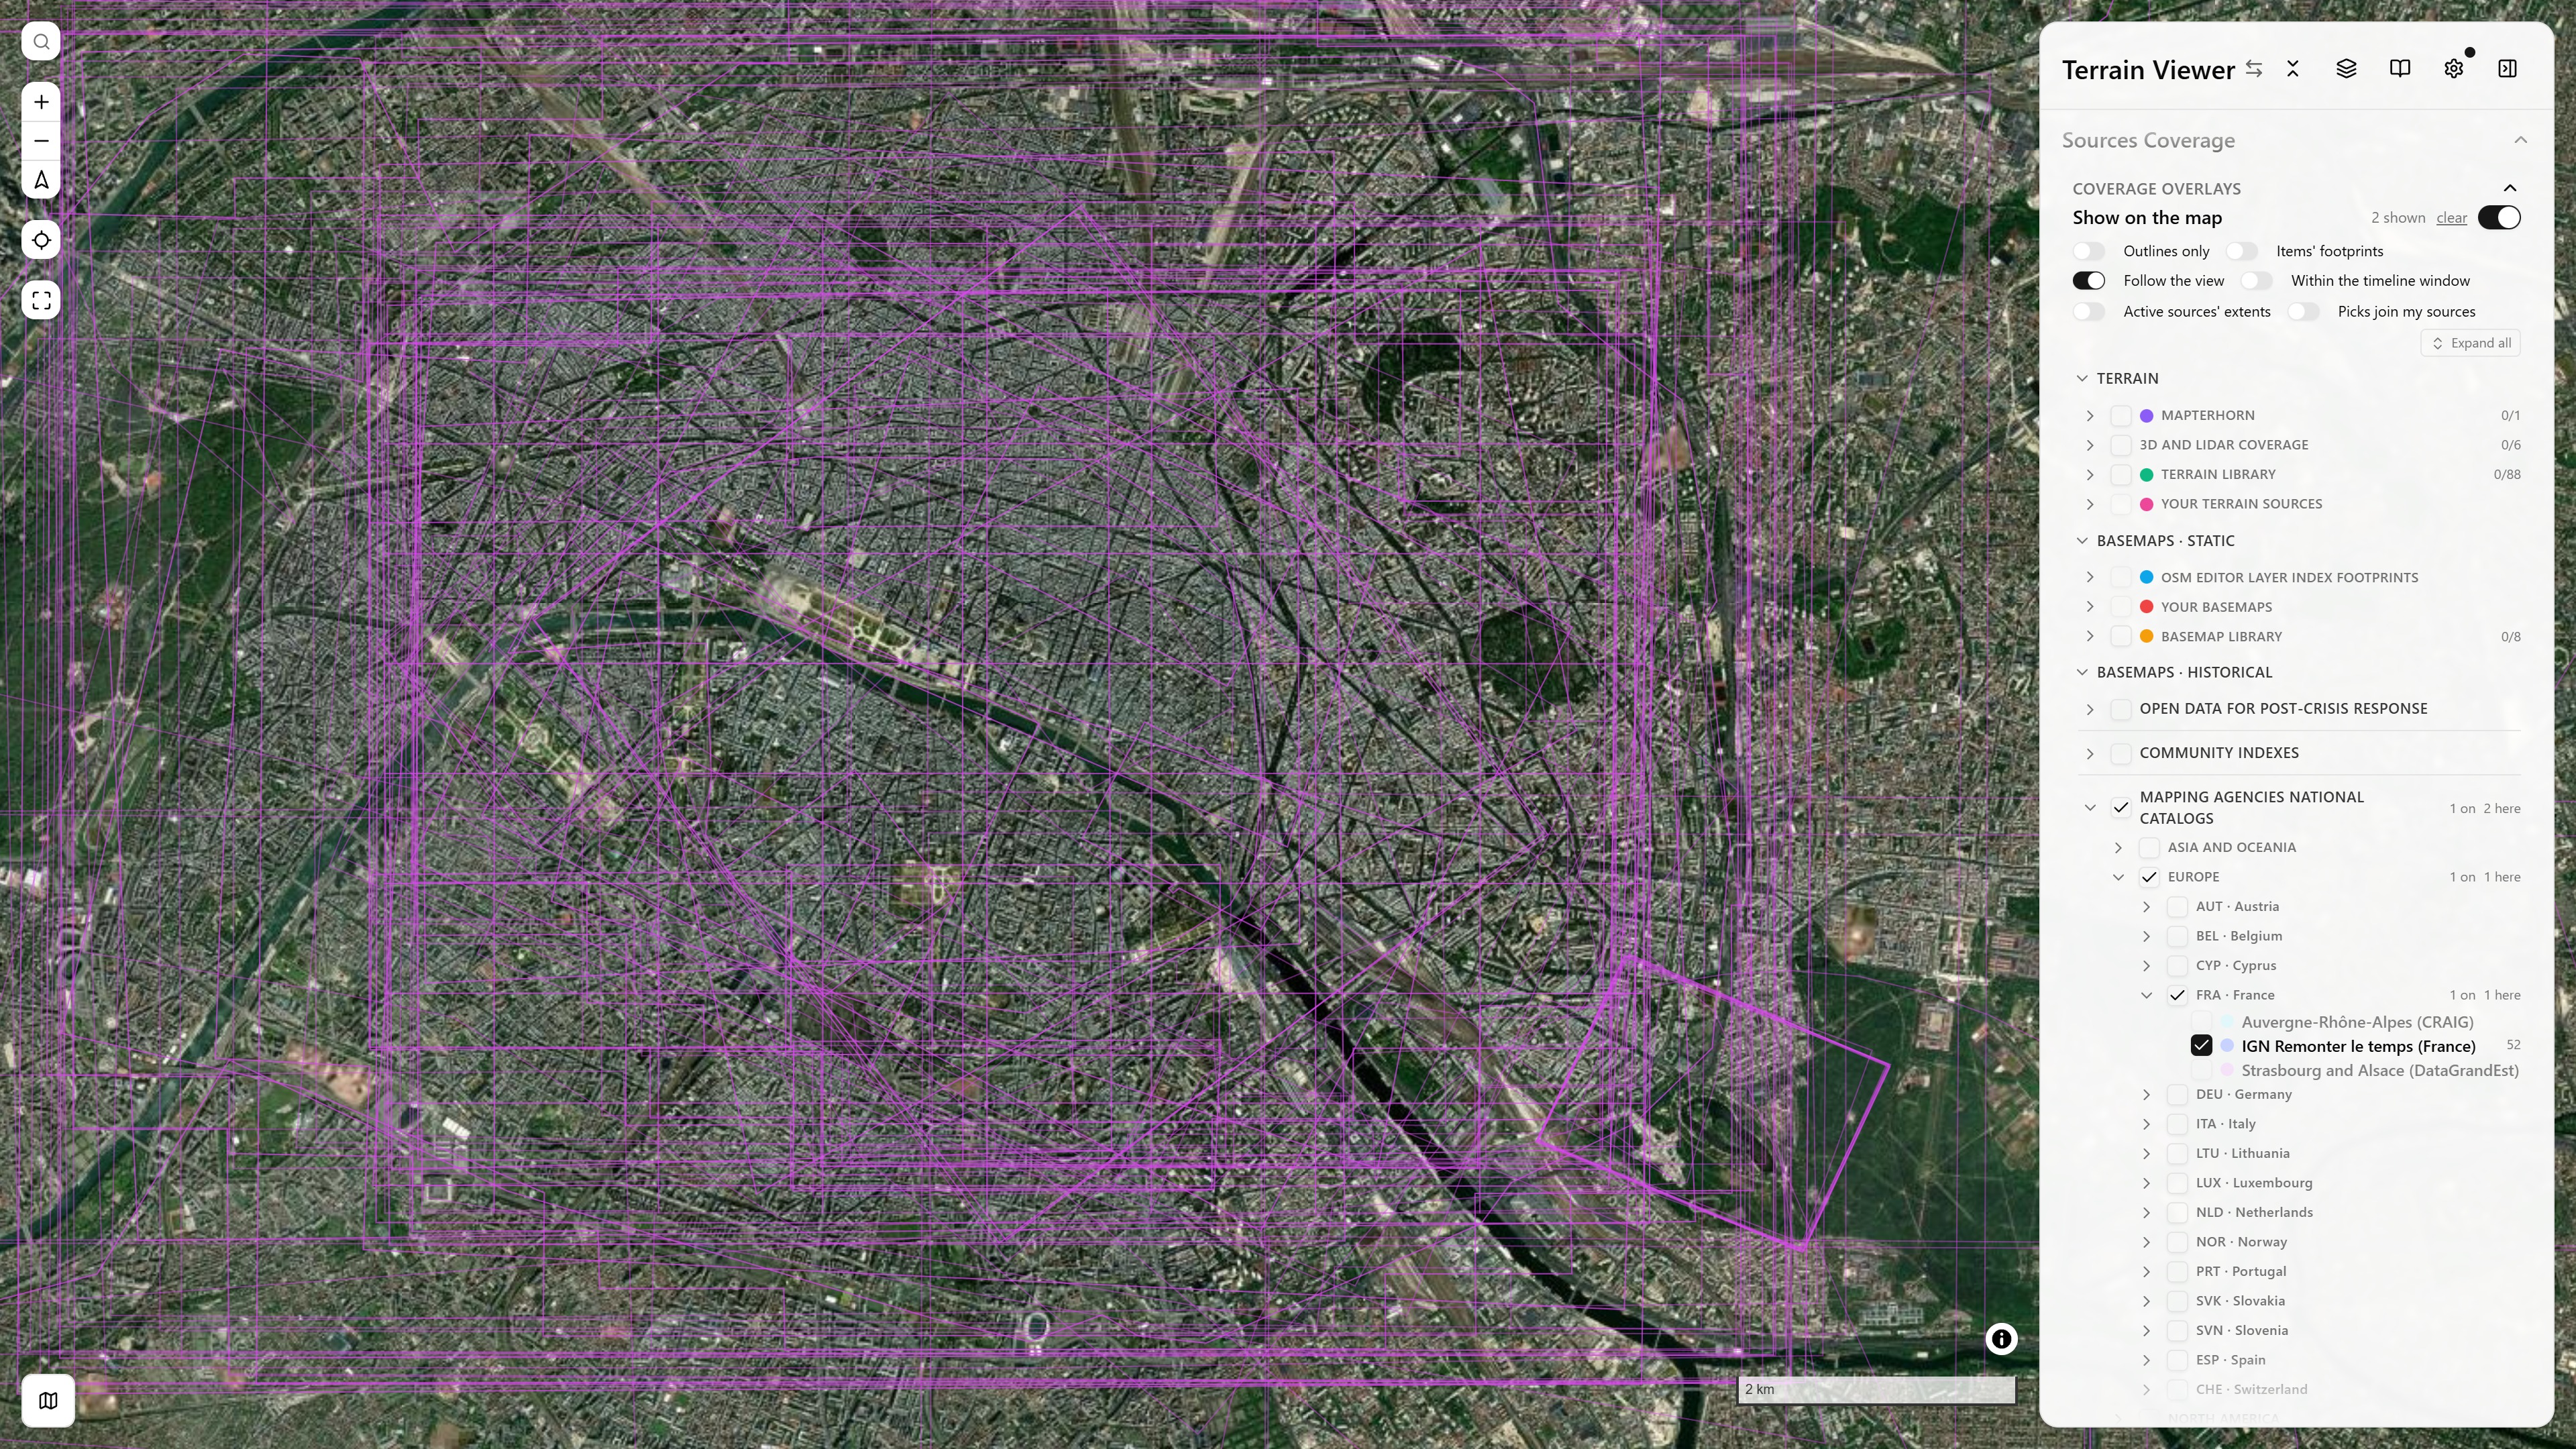
Sources Coverage over Paris: Mapping agencies national catalogs → Europe → FRA · France opened, IGN Remonter le temps on (52 items here), the other French archives dimmed because they do not cover the view; the Allmaps outlines drawn on the map · open in app ↗ (open the folds by hand: they are kept in your browser, not in the link)
The tree is always open at the top of the Sources Coverage section. It has three parts:
- Terrain: Mapterhorn, 3D and LiDAR coverage (Bing, Google, Esri, FLAI, OpenTopography), the terrain library, your terrain sources.
- Basemaps · Static: the ELI coverage (the Editor Layer Index footprints), your basemaps, the basemap library.
- Basemaps · Historical: the timeline's catalogs tree itself, the same tree the timeline's Catalogs select opens (see Historical Imagery Timeline). Its four roots are Open data for post-crisis response, Community indexes (the Editor Layer Index's dated layers, ArcGIS Online, NextGIS QMS), Mapping agencies national catalogs (a continent, then a country with its ISO alpha-3 code) and Old maps, digitised and warped (Allmaps and David Rumsey first, as footprint-only rows since those annotations carry no date, then Allmaps' dated maps, the CORONA Atlas, Map Warper, Wikimaps Warper, SLUB, the USGS topo maps).
A checkbox draws a group or a single entry; the chevron on the left opens it. A row shows how many of its items cover the view ("1 on · 2 here"), and a catalog that has nothing here is dimmed. Every group starts folded except the three parts; what you open is kept across sessions, here and in the timeline's Catalogs select alike.
The switches above the tree:
| Switch | What it does |
|---|---|
| Show on the map | Hides or shows every footprint at once; the selection is kept. clear unticks everything. |
| Outlines only | Footprints without their fill. |
| Items' footprints | Draws the outline of every item the checked historical catalogs found. |
| Follow the view | On (the default), the catalogs are asked again as the map moves. Off, the results stay as they are; switching it on again asks for the current view. |
| Within the timeline window | Asks the catalogs only for items dated inside the timeline's current window. Changing it asks them again. |
| Active sources' extents | Draws the declared extents of the sources on the views (terrain, basemap and overlays) as dashed outlines; a source row shows z≥N while the view is below the zoom it serves. |
| Picks join my sources | On by default: an item picked on the timeline, or put on a view from Search results, joins your overlays and goes on the view as one, over its basemap. Off, it becomes the view's transient basemap, listed nowhere else. Scrubbing a handle or stepping with the arrow keys always swaps the basemap. |
| Expand all / Fold all | Opens or folds the whole tree. |
Leaves with a known extent (your sources, the libraries, the Allmaps maps, every catalog item picked on the timeline) have a zoom-to-fit button.
Search results
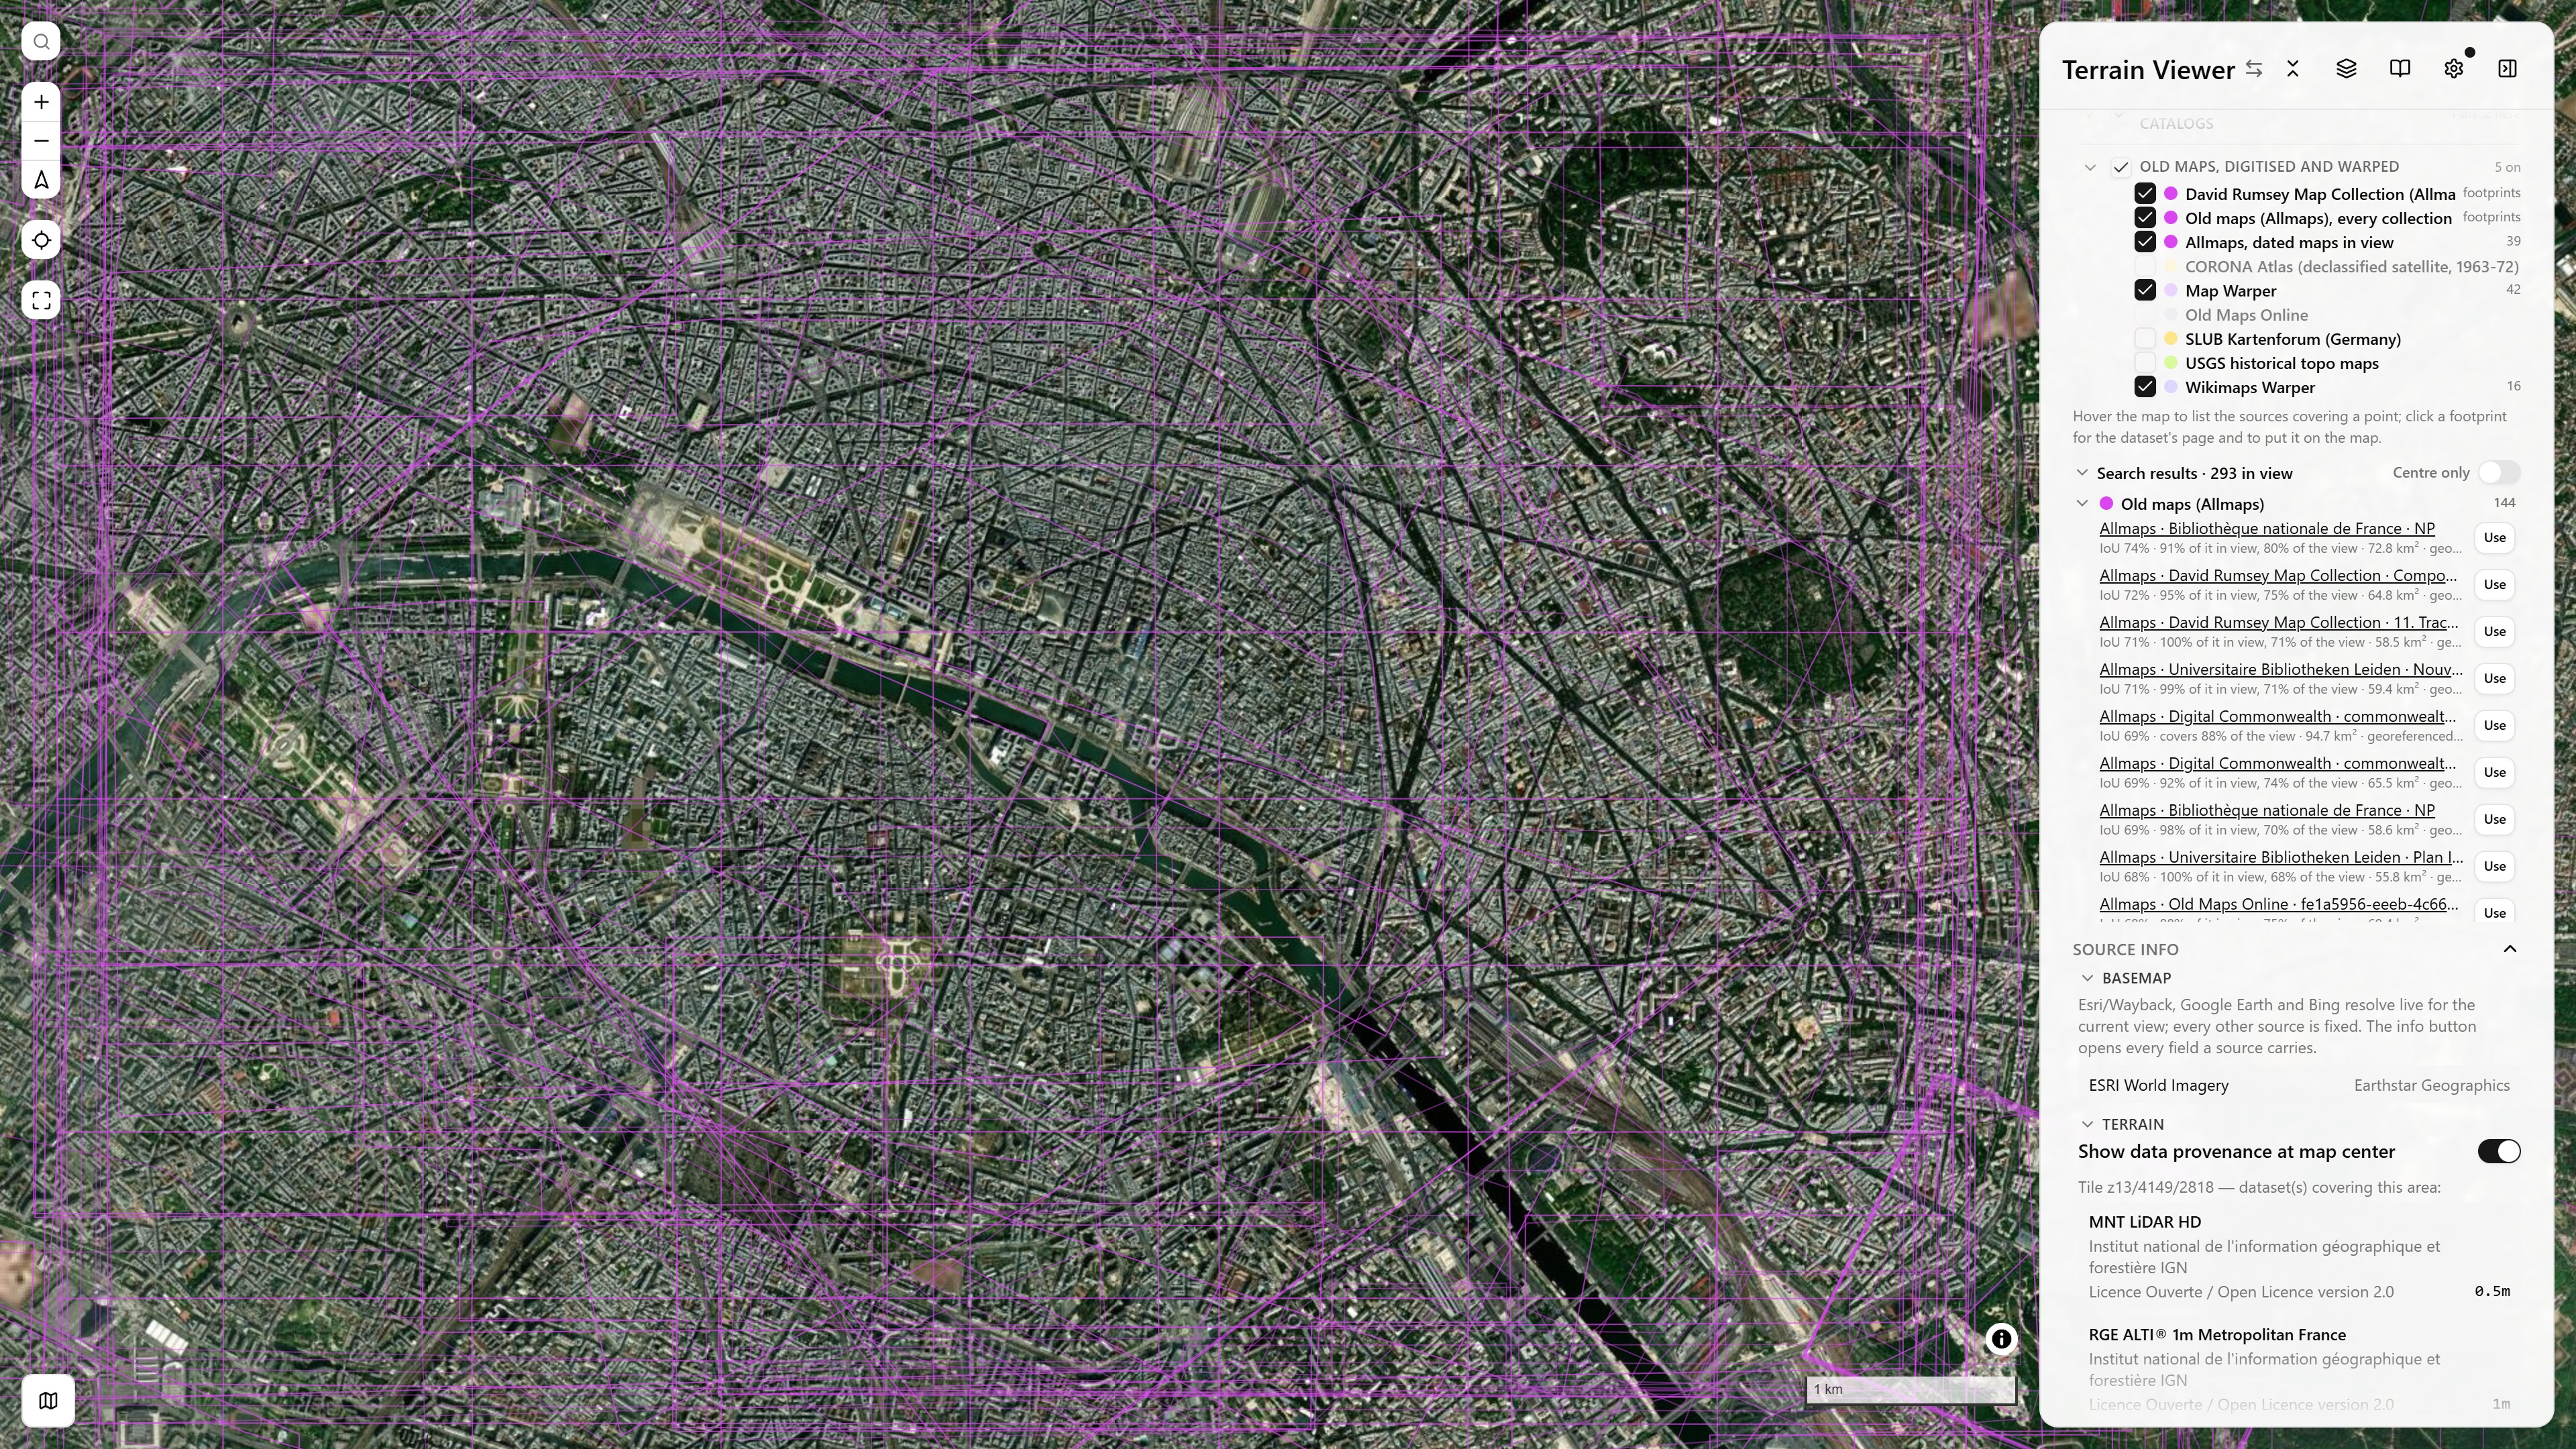
Search results over Paris: 293 sources and catalog items in view, the Allmaps block first, each row with its IoU, how much of it is in view, its area and a Use button · open in app ↗
Search results, under the tree, lists everything the shown overlays and the checked catalogs hold for the view, without clicking on the map. It is one foldable list with a single scroll: a block per group (Mapterhorn, the libraries, 3D and LiDAR, ELI, QMS, Allmaps, your sources, then each historical catalog with its items' dates and resolutions). Rows are ranked by how well each footprint matches the view (intersection over union, IoU), so a city plan comes before a world map that also covers it. Each row says how much of it is in view and how much of the view it covers, links to its page, and has a Use button that puts the source, or the catalog item, on the view. Centre only keeps what lies under the view's centre. The list refreshes when the map settles.
Search by name
The field at the top of Search results searches the catalogs checked in the tree by name, anywhere, not only in the view: type "Cassini" and press Enter. What each catalog can do:
| Catalog | How it is searched |
|---|---|
| Map Warper, Wikimaps Warper | their title search |
| Allmaps, David Rumsey | Allmaps has no text search, so David Rumsey's catalog is searched, and each match is looked up in Allmaps: the maps georeferenced there drape as overlays, dated by Rumsey's record (the others are counted, they cannot drape yet) |
| ArcGIS Online | its item search, world-wide |
| NextGIS QMS | its service search |
| USGS historical topo maps | the quad's name |
| IGN Remonter le temps, the national catalogs | their layer names ("Cassini", "1950", "Luftbild"…) |
Other checked catalogs (the post-crisis STAC collections, SLUB, the CORONA Atlas) cannot be searched by text and are named as such. Each hit has its page, Fit (frames its extent) and Use: a dated item goes on the view and on the timeline like a tick; an undated map (many Map Warper sheets) becomes the view's basemap; a QMS service, the basemap. Over Paris, "Cassini" finds about 70 maps: the Cassini sheets of 1750 to 1789 from Rumsey, the IGN Cassini map, Map Warper's sheets and two ArcGIS services.
Reading the map
- Hover a point to list every overlay covering it in a floating box.
- Click to open the same list as a dialog, with each source's dataset page or catalog record linked, every row prefixed with where it comes from (FLAI, OpenTopography, Terrain library, QMS…); the historical items' footprints (Map Warper, Allmaps, the national archives…) are listed and clickable the same way, and Use puts the item on the view. A filter box at the top narrows a long list by name, collection, type or year. The list is ranked by how well each footprint matches the view (intersection over union): a city plan comes before the world map that also covers the point, and each row says how much of the view it covers and how much of it is in view.
- What each catalog can tell about an item (resolution, date, licence, page, thumbnail) is tabled on Historical Sources.
- A map click while the elevation picker, the sun calculator or a drawing tool is active goes to that tool: no coverage list opens.
- Selected entries show as pills under the picker. A fully selected group is one pill with its count; remove a pill to hide it, or clear to hide all.
Overlays are drawn on all views of a split or grid layout. The selection travels in the share URL (coverageOverlays), folded to group keys where a whole group is on.
Library bounds are the advertised extent of the service, not a survey footprint: a national LiDAR that covers 75 % of the country still shows its whole bounding box. Mapterhorn and the Editor Layer Index carry real polygons. How each footprint is made, and the scripts that build the 3D and LiDAR ones, is on Coverage Footprints.
National Datasets (tablecn)
The national, regional, surface-model and global terrain datasets of the library as one tablecn data table in client mode, for a side-by-side comparison with the National Open-Data Terrain page
Bring Your Own Data (BYOD)
Adding your own terrain/basemap sources, including local files