Tools
Drawing, Elevation Picker, the Sun and Shadow Calculator, Image Georeferencer and Animation
A grab bag of map-based utilities in the sidebar's Tools group, independent of whichever visualization modes are active. Sources Coverage used to live in that group and now sits under Terrain and Basemap — it is documented with the coverage overlays it contains.
The catalog searches (STAC, NextGIS QMS, the Editor Layer Index) are tabs of the Add Terrain and Add Basemap dialogs, not of this group: see Catalog search.
Drawing
Sketch directly on the map — a TerraDraw-based sketch/measure layer for annotating or roughly measuring distances and areas over the terrain, independent of any export pipeline. Tools: Select, Point, Line, Polygon, Rectangle, and Circle (Esc cancels the active tool back to Select — see Keyboard Shortcuts).
- Named layers — multiple layers, each with its own visibility toggle, style, and zoom-to-bounds button; a layer's contents can be imported from a GeoJSON, KML, GPX or FlatGeobuf file, or, from the chevron next to Import, from a URL (those formats plus a Shapefile, whose
.dbf/.prjare fetched alongside), and exported back out. Only the geometry and attributes are loaded: any styling the file carries is ignored, features take the colours of the layer they land in. - Remote layers in a link —
?drawingUrl=https://host/features.geojson(repeatable) loads remote vector data at startup, one layer per URL, and frames it unless the link carries its own camera. Such a layer is re-fetched on every load rather than stored, so the link always shows the current data, while its name and colours are remembered. - Persistence — drawn/imported layers are kept for the session by default; turn on Settings → Browser Local Storage Persistence → Vector Layers to have them survive reloads (OPFS-backed, with a storage-usage readout and Clear button).
- Batch-export targets — in Historical mode, drawn features are the per-feature targets of the Export Multi (Historical) GeoTIFF batch dialog.
Feature Iterator
The loop toggle on a layer row steps through that layer's features one at a time, auto-framing each on the map: lines/polygons get fit to the viewport with a 20% margin, points are centered at a fixed zoom of your choosing (or the current zoom). The index wraps in both directions, clicking a feature of the iterated layer on the map jumps the iterator to it, and →/N, ←, and D/Delete step or delete without touching the panel (full list under Keyboard Shortcuts) — handy for reviewing an imported inventory of sites one by one.
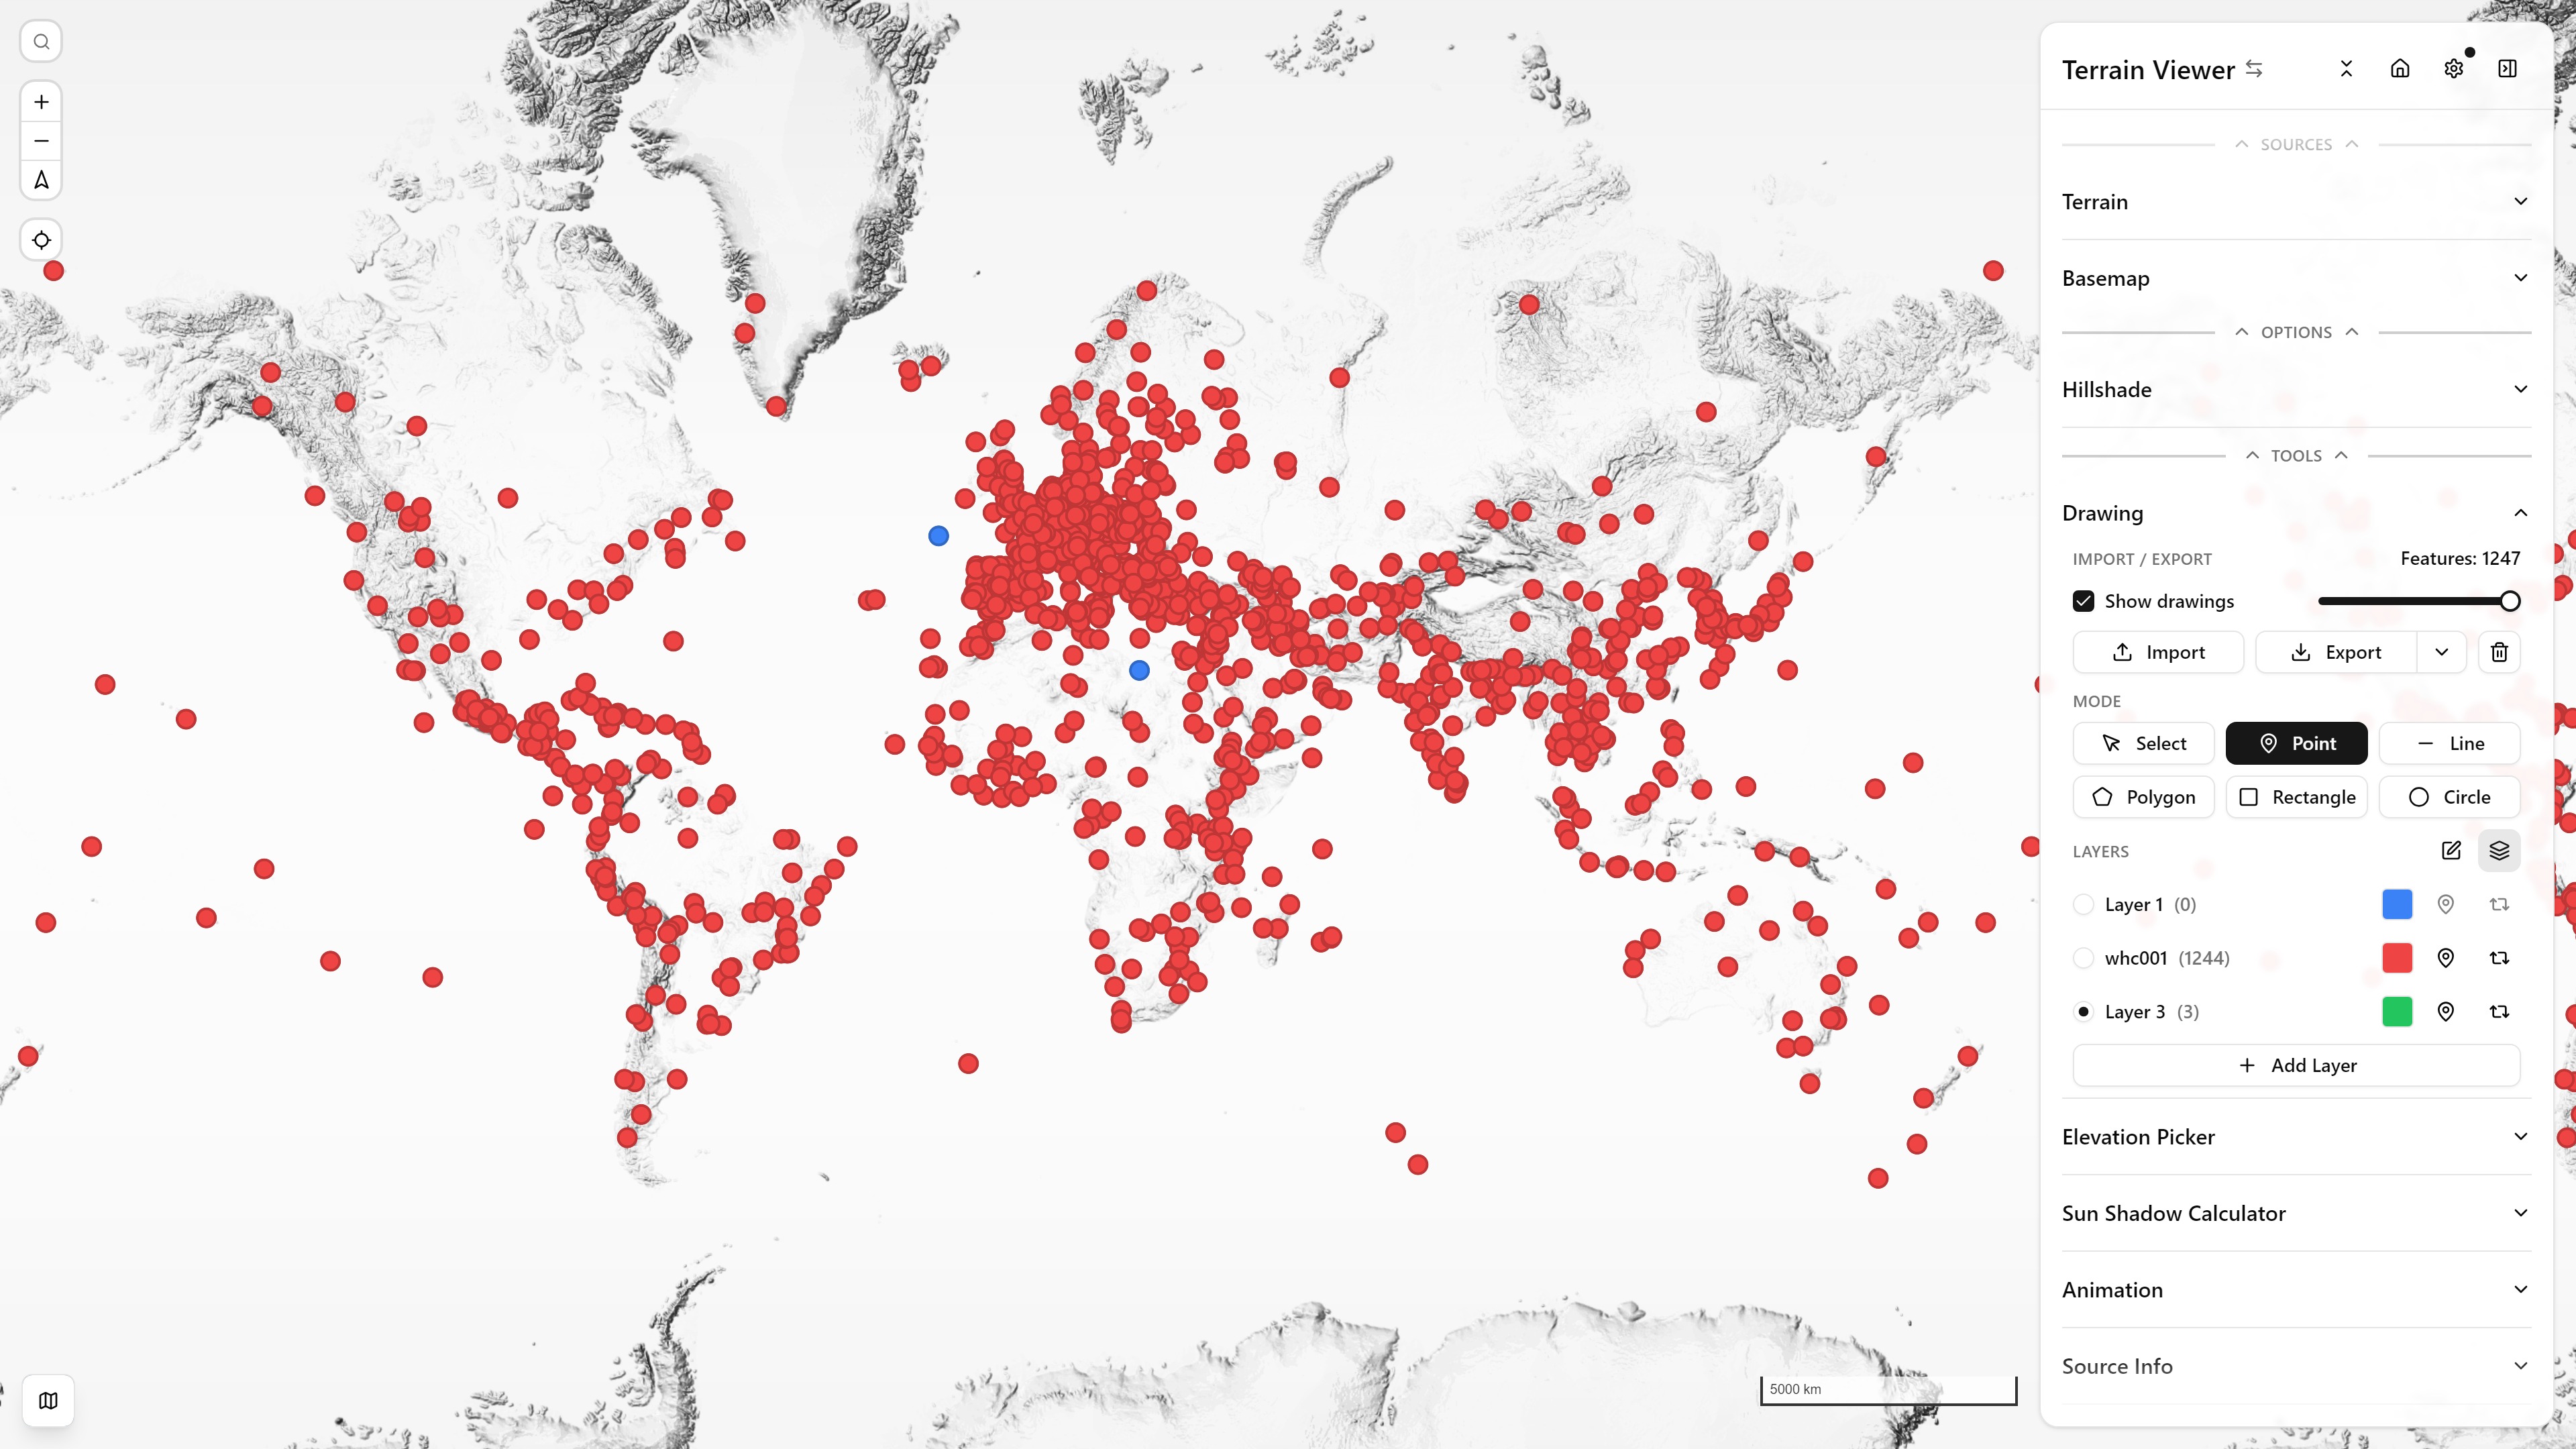
Drawing — an imported GeoJSON layer (world heritage site boundaries) alongside a second, hand-drawn point layer
Elevation Picker
Click anywhere on the terrain to read off its elevation, sourced from the same active DEM driving the rest of the app (Mapterhorn, Mapbox, MapTiler, AWS, or a custom BYOD source) — useful for a quick spot-check without switching on Elevation Hypso or exporting a GeoTIFF. Several distinct modes live under this one toggle:
- Single-point altitude — one click samples the elevation right there.
- Altitude delta — a second click measures the straight-line distance and elevation difference (Δ Elevation) against the first.
- Line profile / line of sight — switches to a full elevation profile chart sampled along the path between two points, plus a mast-height field for a simple line-of-sight check.
- Straight line vs. routed path — the profile can sample a direct great-circle line, or a real routed trail/road (BRouter or Valhalla, with a hiking/bike/vehicle profile) between the two points instead.
- Reading the profile — hovering the chart puts a marker on the map at that sample, on the straight line or the routed path alike; on a phone, drag a finger along it. The wheel zooms the chart around the cursor, a drag pans it, a double-click resets.
- Dock under the map — moves the chart out of the side panel into a bottom panel: the lowest strip, from the left edge to the side panel, like the historical timeline. Everything else at the bottom moves up to make room, the timeline panel (or its button), the minimap, the scale bar and attribution, and the view pills, and the map's centre follows. On a phone it spans the screen width, and it is the way to use the profile there: with the picker on, the first tap on the map closes the side panel and already places point 1, a second tap places point 2, and the profile appears at the bottom. Dragging the map pans it and leaves the panel open; only a tap closes it, and only on a phone. The tools keep working while the panel is closed.
- Sample Reference: Absolute vs. LRM — sample real elevation, or height relative to the local neighborhood mean (same reference the Local Relief Model / Plane Slicer use).
- Plane Slicer — an elevation-threshold plane that paints the terrain above or below a chosen altitude (or LRM height), independent of the point/line picker above.
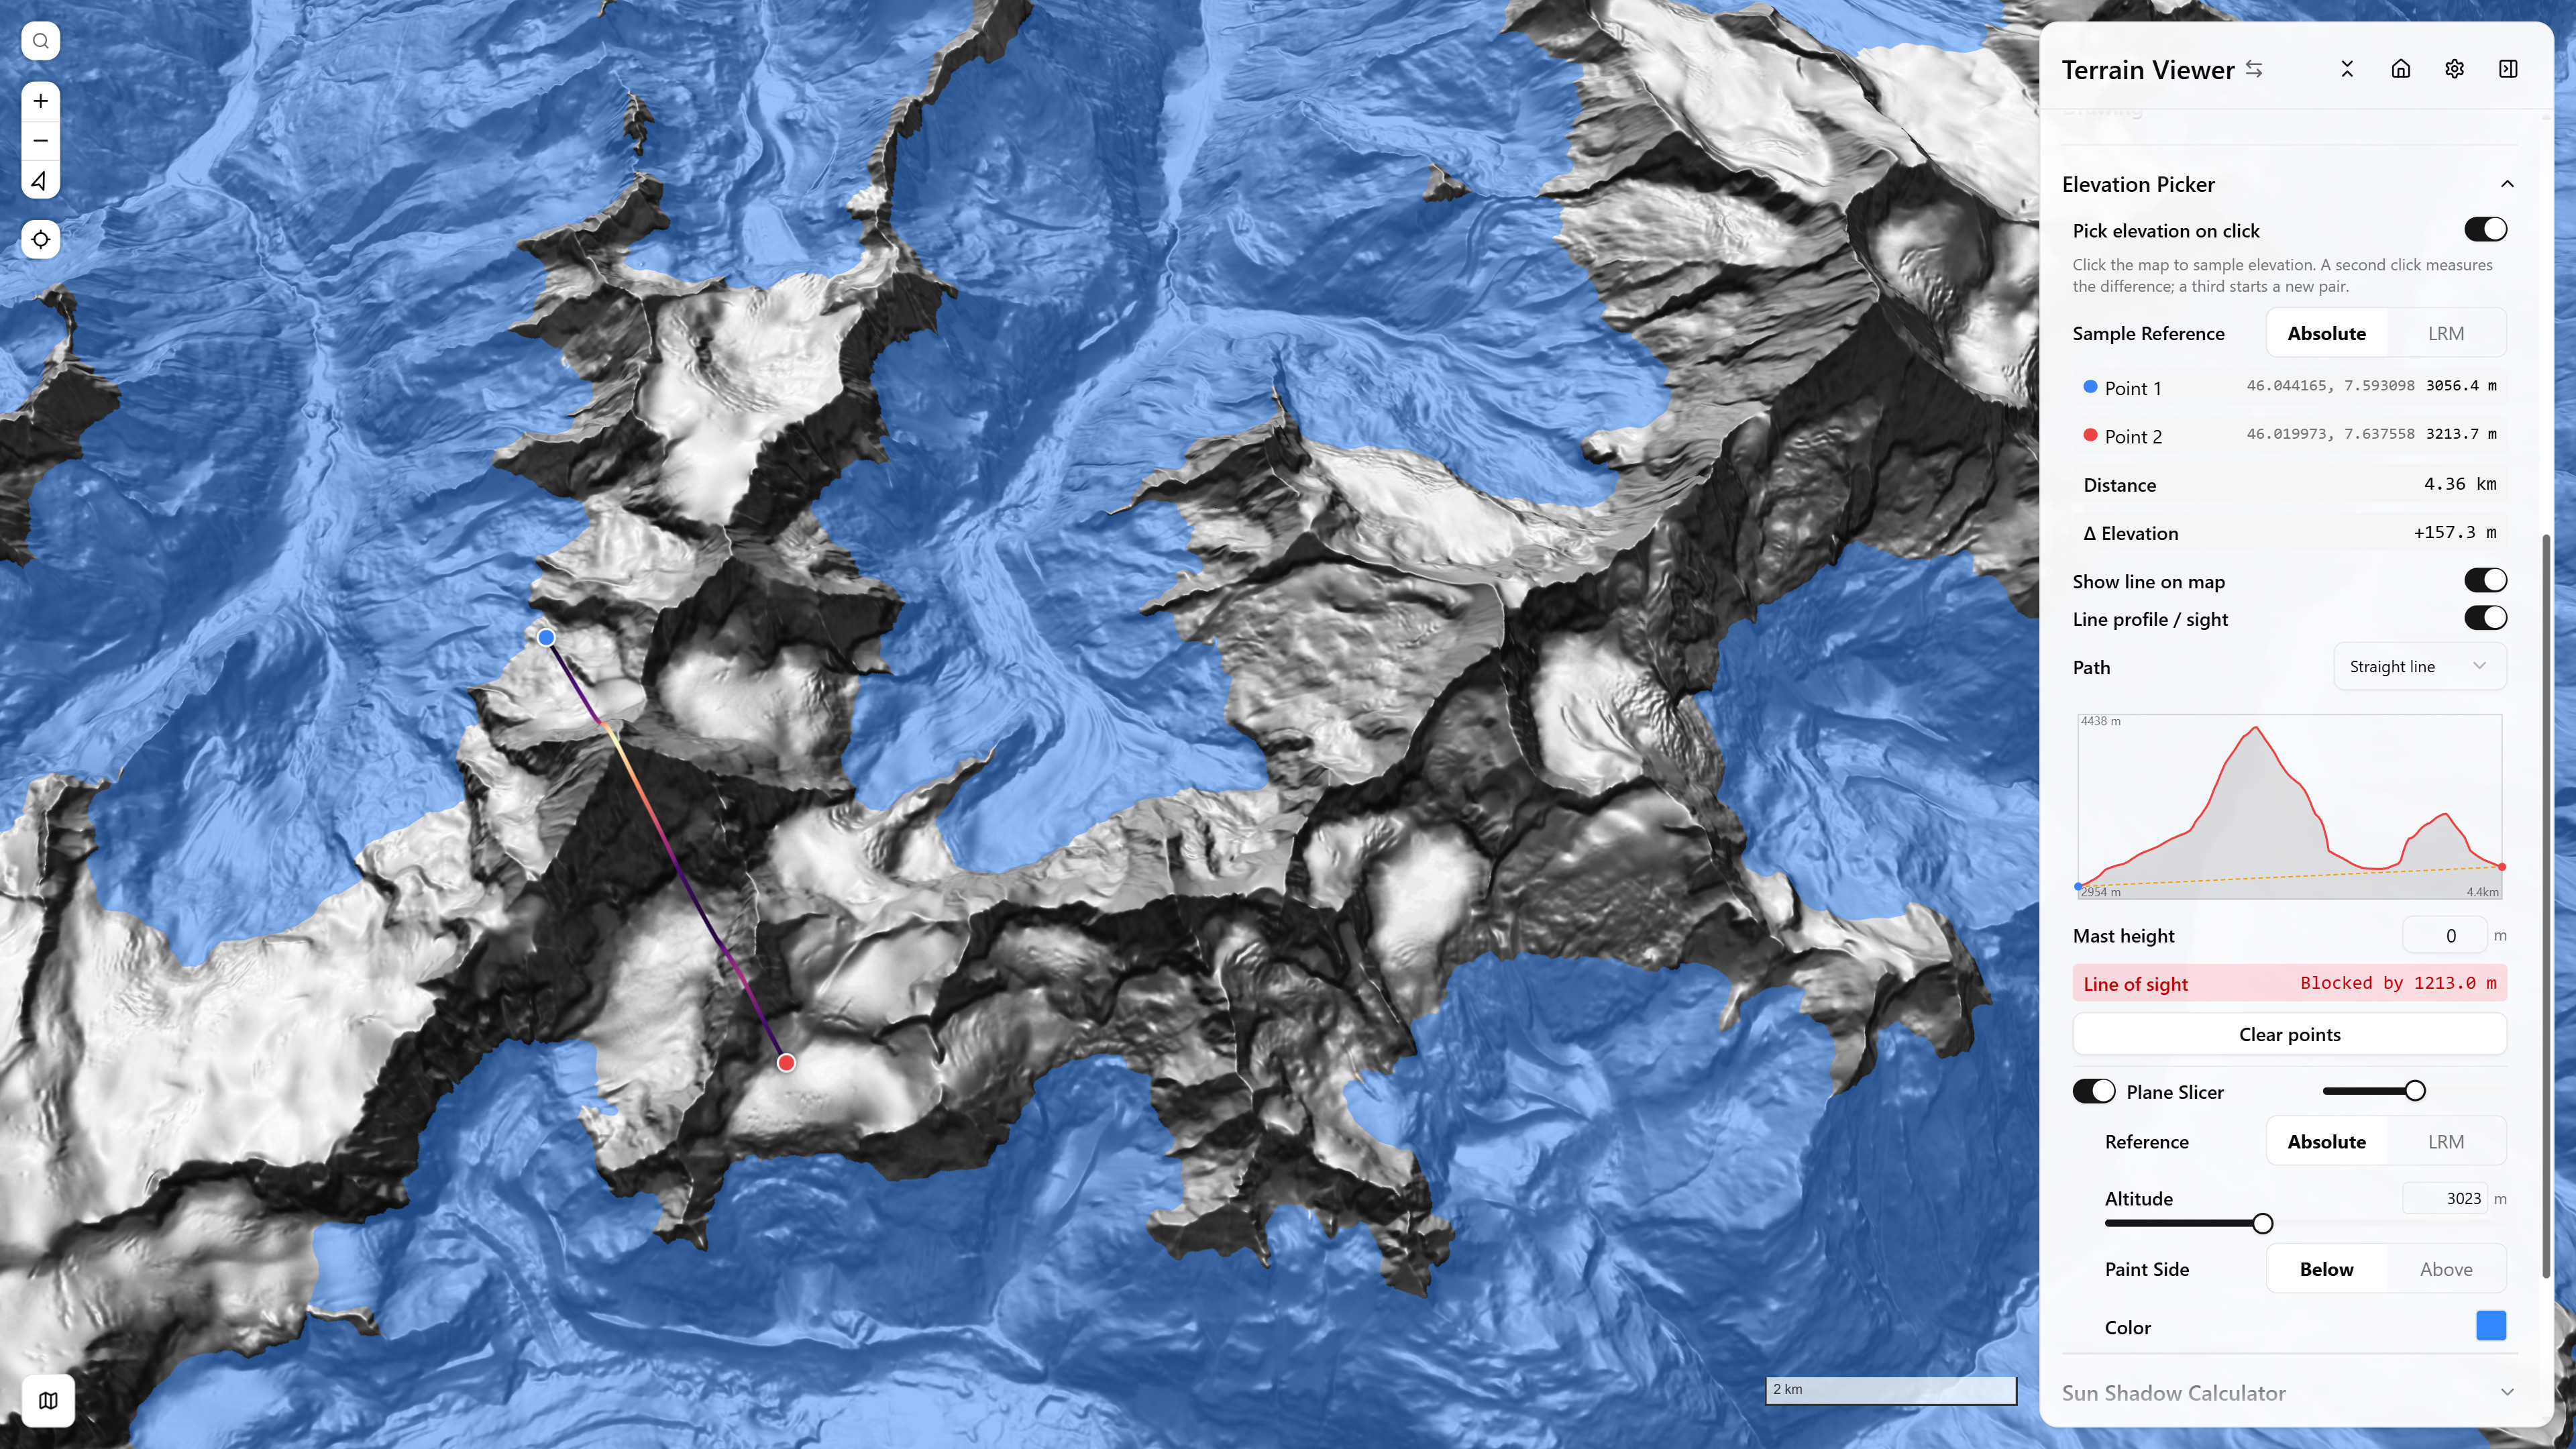
Elevation Picker — Line Profile (two points, color-graded by elevation) + Plane Slicer flood-fill — Matterhorn massif — open in app ↗ (camera/Plane Slicer state only — the two picked points aren't URL-reproducible, pick them on the map yourself)
Sun and Shadow Calculator
Documented on its own page: Sun Position.
The rest of the app points the light and shows the shadow; this tool also runs it backwards. Forward: a point, a date and time and an object's height give its shadow on the map. Reverse: click the base and the tip of a real shadow in the imagery, type the object's height, and read off when the picture was taken. Either way the answer lands in the shared light fields, so Hillshade, Phong and cast shadows follow it at once.
Image Georeferencer
Beta: switch on Image Georeferencer under Settings → Beta; the section then appears in the Tools group.
A plain image with no georeferencing, a figure from a paper, a scanned plan, a drone orthomosaic exported as a JPEG, placed on the map from control points. Open the image from disk or paste its URL: it opens in a floating window over the map (drag its header, resize from any corner, wheel to zoom, drag to pan). With Place control points on, click matching spots on the image and on the map, in any order: the n-th image point pairs with the n-th map point, and both can be dragged afterwards. Each pair gets a number on both sides, and clicking a row in the list enlarges its two marks. From two pairs on, the image appears on the map, drawn through MapLibre's image source above the basemap and under the relief layers, so hillshade and contours still read through it at the chosen opacity.
The fit comes from the Allmaps transform library, without IIIF: Similarity (two points, keeps shapes) is the usual choice for a map figure, Affine (three) adds shear, Projective (four) suits a photograph of a flat map taken at an angle, and Polynomial 2 and Thin plate spline (both beta) bend. The first three are drawn from the four fitted corners, exact on screen. The bending fits warp the image pixel by pixel in the browser first (through the fit's inverse, up to 2048 px a side), then place the warped raster, so the inside follows the points too; the exported world file keeps only the affine through the corners. Residuals in metres are listed per point once there are more points than the fit needs; a point can be removed from the list.
What travels in the link: the points (georefGcps), the fit (georefType), opacity and visibility, and the image when it was loaded from a URL (georefImage). An image opened from disk stays in the browser session. World file downloads an ESRI world file (.pgw or .jgw, in WGS 84 degrees, with a .prj) to put next to the image for QGIS or GDAL.
Save as basemap overlay keeps the result as an overlay in Basemap → Bring Your Own Data → Overlays, an image opened from disk included (it is stored in the browser, like a local COG, and restored after a reload). The overlay remembers its points: its row has a button that reopens the image in the georeferencer with them, so they can be moved and the overlay updated in place (Update the overlay). Zoom to image frames the placed image.
Animation
Fly the camera along a scripted path through the scene — set keyframe camera poses and interpolate between them, exportable as a rendered fly-through. Available in Terrain mode; Historical mode's own Tools group drops it since there's no single continuous elevation surface to fly a smooth camera path over.
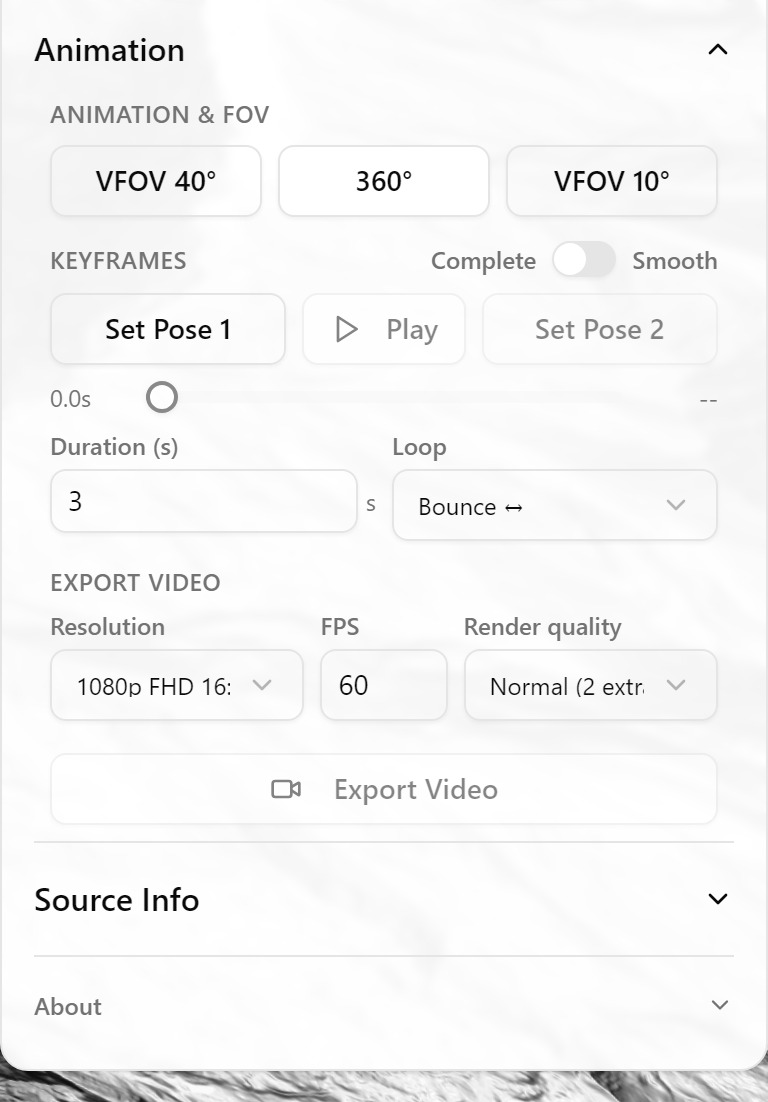
Animation — panel only
Embedding / iframe
Everything the app shows is in its URL — how to compose a link or an iframe that loads your own COGs and vector data, the parameters that are instructions rather than state, and the project JSON preset format
Export & Share
Snapshots, DEM GeoTIFF and contour exports, historical batch export, and social sharing